
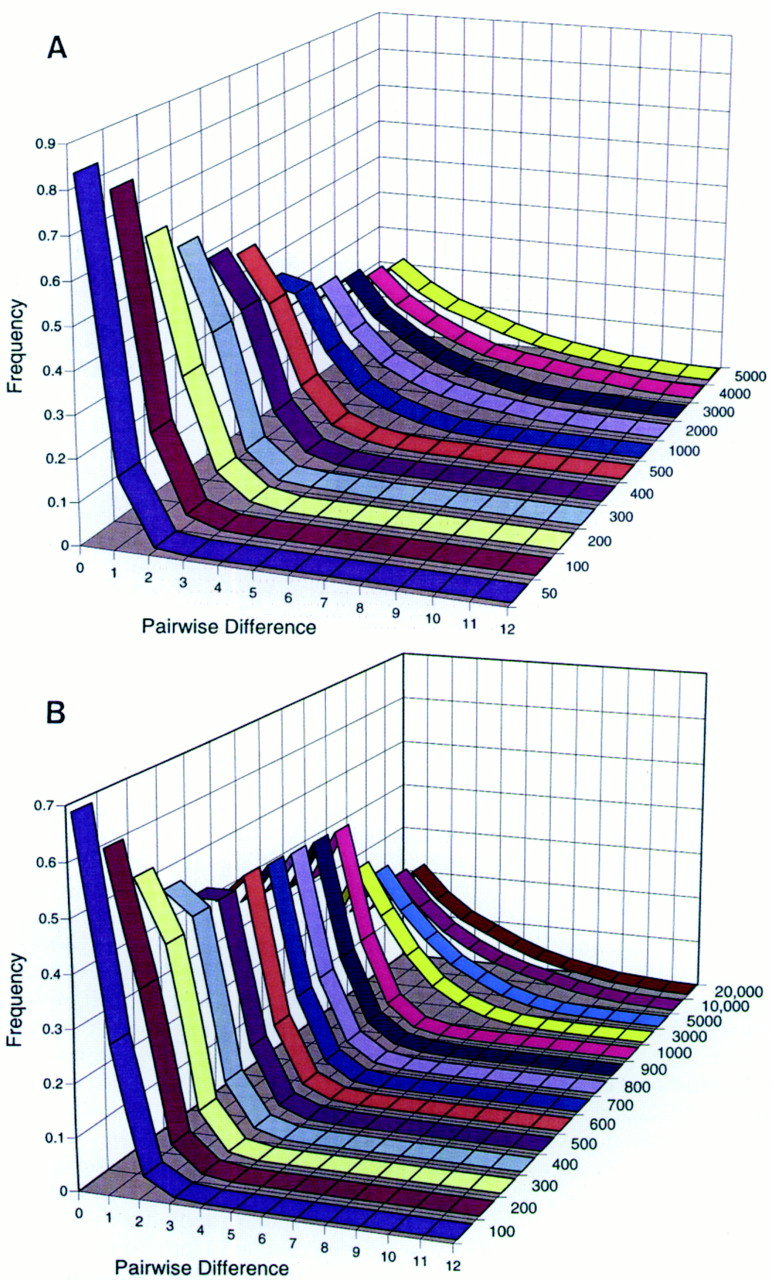
Figure 1.
Computer simulations analyzed using PK distribution. The relationship between effective population size and PKdistribution shape is shown in A. Steady-state PKdistributions are shown for 11 populations ranging inNe from 50 to 5000. The relationship between the time since population expansion and the PK distribution is shown in B. PK distributions for 14 time points (in generations) after a 1000-fold increase in population size. Specifics for the simulations are given in Methods.


