
The Organization of the γ-Glutamyl Transferase Genes and Other Low Copy Repeats in Human Chromosome 22q11
Abstract
A clone map consisting of YACs, cosmids, and fosmids has been constructed covering low copy repeat regions of human chromosome 22q11. A combination of clone restriction digest analysis, single-copy landmark content analysis, HindIII–Sau3AI fingerprinting, and sequencing of PCR products derived from clones was required to resolve the map in this region. Seven repeat-containing contigs were placed in 22q11, five containing γ-glutamyl transferase (GGT) sequences described previously. In one case, a single interval at the resolution of the YAC map was shown to contain at least three GGT sequences after higher resolution mapping. The sequence information was used to design a rapid PCR/restriction digest technique that distinguishes the GGT loci placed in the YAC map. This approach has allowed us to resolve the previous cDNA and mapping information relating to GGT and link it to the physical map of 22q11.
[The sequence data described in this paper have been submitted to EMBL under accession nos. Z93342 (gene 11; EMBL identification no. HSGGT11), Z93343 (gene 12; EMBL no. HSGGT12), Z93344(gene 1; EMBL no. HSGGT1A), Z93345 (gene 2; EMBL no. HSGGT2A), Z93346(gene 3; EMBL no. HSGGT3A), Z93347 (gene 3-like; EMBL no. HSGGT3L), andZ93348 (gene 6; EMBL no. HSGGT6).]
The human genome consists of high, medium, and low copy repetitive DNA and single-copy DNA (Britten and Kohne 1968). Low copy repeated sequences have been observed as multigene families either clustered or scattered throughout the genome. Some repeated sequences have been detected on a limited number of chromosomes, for example, β-glucuronidase pseudogenes on chromosomes 5, 6, and 22 (Sargent et al. 1994). Chromosome-specific repeats have also been identified on chromosome 5 (Thompson et al. 1993), chromosome 16 (Germino et al. 1992; Stallings et al. 1992), chromosome 19 (Ashworth et al. 1995), chromosome 22 (Halford et al. 1993; Collins et al. 1995), chromosome X (Bardoni et al. 1988; Li et al. 1992), and chromosome Y (Ngo et al. 1986).
Low copy repeat sequences interfere with genome mapping techniques and require specialized approaches. It is not always immediately apparent that these sequences occur more than once in the genome. For instance,Stallings et al. (1992) noted that repetitive sequences had resulted in apparent false overlaps in a cosmid contig on chromosome 16. A region of low copy repeats was also found on chromosome 19, but a modified fingerprinting method was able to resolve cosmids in this region (Olsen et al. 1994). Repetitive DNA also leads to yeast artificial chromosome (YAC) instability (Neil et al. 1990), which hampers the YAC mapping strategy.
Chromosome 22 contains a number of low copy repeats in q11 including anonymous DNA fragments and expressed sequences. Complex restriction fragment patterns were obtained from Southern blots hybridized with D22S209 (Dumanski et al. 1991) and D22S207 (Carlbom et al. 1991). Fluorescence in situ hybridization (FISH) studies showed that a number of probes detected sequences on either side of a balanced translocation in 22q11 (Lindsay et al. 1993) and comparisons to primate DNA suggested a recent evolutionary origin for these repeats (Halford et al. 1993).Croce et al. (1987) mapped three breakpoint cluster region (BCR)-like loci to 22q11. Heisterkamp and Groffen (1988) isolated cosmid clones with the BCR cDNA and detected fragments of the gamma-glutamyl transferase (GGT) gene in close proximity. The human GGT cDNA (Rajpert De Meyts et al. 1988; Sakamuro et al. 1988) was assigned to human chromosome 22 using in situ hybridization (Bulle et al. 1987) and at least four copies were identified in man, whereas only one was found in rat (Pawlak et al. 1988). Pawlak et al. (1989) went on to describe two human cDNA clones, GGTI transcribed in adult liver and kidney, and GGTII transcribed only in the kidney. Courtay et al. (1994) isolated seven genomic clones that could encode the GGT mRNA. They concluded that a single GGT locus encoded a ubiquitously expressed gene and proposed that a further four genes were expressed in a tissue-specific manner. At least four immunoglobulin λ (IGL)-like loci have been mapped to chromosome 22, VpreB (IGLV-derived) (Bauer et al. 1988) and 14.1, 16.2, and 16.1 (IGLC-derived) (Chang et al. 1986; Schiff et al. 1989), now called IGLL1, IGLL2, and IGLL3, respectively (Bauer et al. 1993).
During the assembly of a chromosome 22 YAC collection, we identified several groups of low copy repeats mapping to 22q11 (Collins et al. 1995). Initial landmark content analysis produced conflicting results and contigs could not be constructed. To overcome these problems we have used a series of approaches to construct and refine the physical map of this region. YACs containing different loci of a repetitive landmark were identified by restriction enzyme analysis and together with other single-copy landmark data from the surrounding YACs a series of contigs was assembled (Collins et al. 1995). Bacterial clones were isolated using the GGT sequence from cosmid and fosmid libraries and placed into intervals defined by the YAC clones. A 387-bp region encompassing part of the GGT gene was amplified from YAC and bacterial clones representative of each interval, sequenced, and compared with the sequences obtained by Courtay et al. (1994). This allowed the sequences of Courtay et al. to be positioned relative to the YAC map (Collins et al. 1995), identifying one sequence per interval, except in the GGT.2 interval, which contains at least three different loci. This analysis indicates the extremely high level of sequence homology between these loci. The detailed and high resolution mapping necessary to resolve these repeats has major implications for future genome mapping and sequencing projects.
RESULTS
Construction of a long-range map of 22q11 revealed seven regions containing low copy repeat landmarks, five of which included a GGT locus, numbered GGT.1 to GGT.5 from the centromere (Fig.1). Initially, the landmark content strategy used to assemble the 22q YAC map (Collins et al. 1995) was insufficient to assemble contigs in 22q11 and further mapping techniques were required. A combination of clone restriction digest analysis,HindIII–Sau3AI fingerprinting (Coulson et al. 1986), and sequencing PCR products derived from clones was employed. Forty-one YACs contained both GGT and BCR-like sequences (D22S287E), consistent with the observations of Heisterkamp and Groffen (1988).
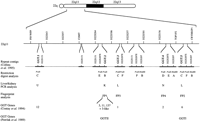
Map position of low copy repeats and summary of diagnostic mapping information. An ideogram of 22q is shown; below is a line representing 22q11 with the genetic landmarks described by Buetow et al. (1994) indicated (not to scale) and covering a distance of 34.2 cM. The seven repeat-containing contigs are indicated by a solid line separated by dashes. The repetitive landmark content or GGT interval of the seven repeat-containing contigs is shown above the line representing each contig. Below each landmark further mapping information is shown where appropriate, with the analysis performed indicated on the left. The PvuII and HindIII fragments are as labeled in Table 2. (L) GGTI (liver)-amplified fragment; (K) GGTII (kidney)-amplified fragment; (N) neither GGTI- or GGTII-amplified; and (U) unknown. (FP1–FP4) Bacterial clone contigs constructed by fingerprinting as described in the text. The GGT genes 1–3, 6, 11–13 are numbered according to Courtay et al. (1994) and the GGT genes I and II are numbered according to Pawlak et al. (1989). Gene 13 has not been placed in this interval experimentally, but displays a single base missing as compared with gene 11 (Table 3), hence the ? symbol.
Identification of YACs Containing Low Copy Repeats in 22q11
During screening of whole genomic YAC libraries with chromosome 22 landmarks, GGT, BCR-like (D22S287E), KI-1640 (D22S207), and KI-145 (D22S131) identified between two and five times as many clones as expected for a single-copy sequence. A total of 138 YACs were found to contain at least one of these repeated landmarks, of which 76 YACs contained more than one (Table 1).
The Number of YACs Identified with Repetitive Landmarks in 22q11
Separating Repeated Landmarks
To establish whether GGT, D22S287E, and D22S207 mapped to more than one locus, Southern blots of genomic DNA restriction digested with a panel of enzymes were hybridized separately with the labeled PCR products of GGT1/2 and D22S287E, and hexamer-labeled D22S207 DNA. The enzymes that gave the largest number of restriction fragments were used to digest the DNA of five unrelated individuals (10 chromosomes) to indicate whether the fragments observed were attributable to restriction fragment length polymorphisms (RFLPs). Three combinations of restriction enzymes and probes showed potentially useful patterns of restriction enzyme fragments (Table 2). The GGT1/2 sequence-tagged site (STS) identified five PvuII fragments in genomic DNA with no evidence that these fragments were attributable to RFLP. The D22S287E STS identified two PvuII fragments, with the D22S287E.E displaying a polymorphic 2.3-kb fragment as identified in a single YAC from the Imperial Cancer Research Fund (ICRF) library (see GGT.2 contig in Fig. 1 for mapping position). The D22S207 probe identified two HindIII fragments that were placed into three intervals in the YAC map. The restriction enzyme analysis was used with the single-copy landmarks to place groups of YACs into regions of 22q11 (Fig. 1; Collins et al. 1995, Fig. 2). Some of the landmarks, GGT.C, D22S287E.E, D22S287E.F, and D22S207.B, were still present in more than one interval as compared with surrounding single-copy landmarks.
Fragments Detected in Genomic DNA by Chromosome 22 Landmarks
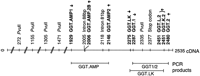
The cDNA sequence of GGT is shown as a black horizontal line. Diagonal bars indicate where regions have been omitted for display purposes. Numbering is as in the EMBL/GenBank sequence release no. J04131. PCR primers are shown as bold characters with the region amplified marked by a bar below. The 3′ end of each primer is indicated by an arrow. Two intron sequences are indicated at 2005 and 2118 bp.
Further clones containing repeated landmarks were isolated with the GGT1/2 STS from three bacterial clone libraries made from flow-sorted chromosomes representing ∼17 chromosome equivalents. The 158 clones were grouped by use of the diagnostic PvuII restriction enzyme digestion (see Table 2), indicating 80 GGT.B clones, 58 GGT.C clones, and 20 GGT.D clones (no GGT.A clones were identified). GGT.C clones maps to the GGT.1, GGT.3, and GGT.5 intervals and GGT.D clones map to the GGT.4 interval, which is consistent with the number of clones isolated (Fig. 1). However, GGT.B maps to a single interval (GGT.2) but appeared to be over-represented in all three libraries, averaging four clones for every one anticipated. These data suggest that there is either a large cloning bias for sequences in this region or that there is more than one GGT.B locus in the GGT.2 interval. All 78 clones from the N library were also tested with the D22S287E, D22S207, and D22S131 landmarks. The results were consistent with the YAC map landmark order. Cosmids in the GGT.3 interval were also found in the cosmid map across the IGLC region (Frippiat et al. 1995).
Cosmid clones from the N library were subjected toHindIII–Sau3AI fingerprint analysis (Coulson et al. 1986). The clones fell into four contigs (Fig. 1). Contig FP1 (34 cosmids) contained only cosmids from the GGT.2 interval, contig FP2 (11 cosmids) contained GGT.5-interval cosmids, contig FP3 (13 cosmids) contained GGT.3-interval cosmids, and contig FP4 (five cosmids) contained GGT.4-interval cosmids. The large number of GGT.B cosmids from the GGT.2-interval fingerprinted into a single deep stack.
Pawlak et al. (1989) published cDNA sequences termed GGTI and GGTII. Northern blotting showed that GGTI is detected in liver and kidney, whereas GGTII is only detected in kidney (Goodspeed et al. 1989; Pawlak et al. 1989). All bacterial clones were used in a PCR assay with two pairs of primers that detect either a GGTI (GGT.L) or GGTII (GGT.K) cDNA sequence (D. Figlewicz and G. Rouleau, pers. comm.) by priming from single base differences between these two sequences (Fig.2). The clones fell into three groups: amplified with the GGT.K primers (all GGT.2-interval clones), amplified with the GGT.L primers (all GGT.3- and GGT.5-interval clones), or not amplified with either primer (all GGT.4-interval clones), suggesting that the intervals GGT.3 or GGT.5 or both contain the GGTI gene and the GGT.2 interval contains the GGTII gene.
Courtay et al. (1994) described seven very similar genomic GGT sequences and proposed that these represented seven GGT genes. Courtay et al. sequenced between bases 1902 and 2148 (amino acids 414 to 493) of the cDNA sequence J04131 (Fig. 2). These exon-only sequences showed several single nucleotide differences as listed in Table3. To establish the position of the sequences identified by Courtay et al., 24 cosmids from the N library that mapped to different regions of 22q11 were chosen for sequencing. These were amplified with the GGT.AMP primers (1929 to 2146 in J04131) and sequenced using the GGT.AMP primers and an internal primer GGT.AMP 2B. Comparison of the sequence differences shown in Table 3 revealed five of the seven sequences described by Courtay et al., positioning these genes into intervals of the YAC map (Fig. 1). There were no cosmids containing gene 12 or 13 sequences, and a new sequence, gene 3-like (one base different to gene 3 within the 88-bp intron), was identified. These data also showed that the GGT.2 interval contains at least three distinct sequences. As the N cosmid library was made from a single chromosome these sequences cannot represent polymorphism of a single locus in the GGT.2 interval. However, they are not far enough apart to be positioned into separate intervals in the YAC map. The published GGT.AMP sequence of gene 13 is very similar to gene 3 and 11, suggesting that this too is a GGT.2 locus. However, this cannot be confirmed until a clone with this locus is identified. To confirm the cosmid sequencing data and GGT gene mapping, two YACs from each of the five loci in the map were amplified with GGT.AMP. The sequence of 10 PCR products confirmed the cosmid sequence and other mapping data without exception. The gene 12 sequence was found in the GGT.1 YAC map interval, although this locus was not represented in the bacterial clones. The two YACs covering the GGT.2 interval contained gene 3 and gene 11.
Nucleotide Variation in GGT Sequences
The locus corresponding to the GGT.A PvuII fragment (Table 2) does not appear in the YAC map (Collins et al. 1995). Somatic cell hybrid data (not shown) suggests that it is on chromosome 22, although no clones were isolated from the chromosome 22-only cosmid and fosmid libraries. One possible map position for this GGT sequence is neighboring N52H8 and D22S446 (Collins et al. 1995, Fig. 2), as one YAC in the map, yR34IC11, contains GGT.A. This region lies in the middle of the IGLV locus (Frippiat et al. 1995), a region known to undergo chromosomal rearrangement, and so perhaps unstable in YACs. Because none of the other GGT.A YACs map to this interval and because of the possibility of chimerism in yR34IC11, the GGT.A landmark could not be placed in the map.
Simplifying GGT Loci Identification
Placing the GGT loci on the YAC map had used time-consuming and complex procedures that did not separate all the loci (see GGT.C above). The YAC and cosmid sequence analysis was used to design a simpler GGT locus detection and separation method. Analysis of the sequence of the GGT loci showed that three restriction enzymes could be used to distinguish each of the YAC map intervals (Table4).
Size of Restriction Fragments Produced by Digestion of the GGT–AMP PCR Product from the Five GGT Intervals
DISCUSSION
The presence of low copy repeats in 22q11 hampered the assembly of a landmark content YAC map across the region. Methods were developed to distinguish repetitive landmarks by cleavage of cloned DNA with restriction enzymes followed by Southern blotting and hybridization, or by restriction enzyme digests of PCR-amplified products from individual clones. It is clear from the experiments using the single chromosome flow-sorted cosmid libraries that the multiple bands detected by the Southern blot analysis of the GGT loci were not attributable to RFLPs. This was not confirmed for D22S287E or D22S207; however, the data presented make it unlikely that they are RFLPs. The blotting method was complex and time-consuming and did not distinguish all the loci in the YAC map into single-copy landmarks. Although the PCR amplification and restriction enzyme digest method was simpler, it required obtaining sequences displaying nucleotide differences between loci that disrupt an enzyme site. The sequence analysis of PCR-amplified fragments proved the most robust and comprehensive method for detecting the differences between these loci.
Examination of the GGT family of loci in more detail suggests there may be up to eight different loci. YACs were identified for six GGT loci, five in the map and one not placed. The sequence analysis indicated two possible additional loci in the GGT.2 YAC map interval. Figlewicz et al. (1993) observed more intense hybridization signals, as compared with a single-copy landmark, with a GGT probe that maps to this region and concluded that there were multiple copies of the locus in this interval. These loci may be too close together to detect different intervals in the YAC map. Courtay et al. (1994) showed that gene 6 was expressed in all tissues tested. This has been mapped to the GGT.5 interval on the YAC map and is the same nucleotide sequence described by Pawlak et al. (1989) as GGTI. GGTII (Pawlak et al. 1989) is the same as the gene 3 sequence, maps to the GGT.2 locus in the YAC map, and is a kidney-specific transcript on Northern blots (Goodspeed et al. 1989;Pawlak et al. 1989), as confirmed by the kidney-specific GGT primers. Four other genes were found to be expressed by Courtay et al. (1994) in a tissue-specific manner and these have also been mapped to GGT intervals on the YAC map (Fig. 1). The fate of the other transcripts is unknown.
The reason for the numerous GGT loci (at least eight) in man is unclear. Compared with gene 6 (J04131 and GGTI), gene 1 contains two single base differences that do not alter the amino acid sequence; genes 3 and 11–13 lose the reading frame at 1930 bp and gene 2 at 1980 bp with the correct reading frame regained after nine amino acid residues in gene 3 and 11. Expression studies have shown gene 6 mRNA in every tissue tested, whereas genes 1–3 and 13 were tissue-specific. The rat genome contains a single GGT locus (Pawlak et al. 1988). It is possible that many of the GGT loci are products of the chromosomal duplications that appear to have occurred in 22q11, often in association with a BCR-like (D22S287E) sequence (Heisterkamp and Groffen 1988).
The low copy repeats are dispersed across 22q11. PCR amplification of many of these groups of loci suggests they contain very similar nucleotide sequences, at least over short distances. Each block of repeats contains a subset of loci with no one region containing them all. Undoubtedly there are more repeated loci in 22q11 as the map shows only those used to screen the libraries or the chromosome 22 YAC collection. The region has been shown to be unstable with interstitial deletions leading to the CATCH22 phenotype (Scambler 1993). The instability could be attributable to recombination between the dispersed repeats, as seen on the X chromosome in the deletion causing steroid sulphatase deficiency (Yen et al. 1990) and the inversion in factor VIII causing severe hemophilia A (Lakich et al. 1993; Naylor et al. 1993), as well as a duplication on 17p causing a gene dosage increase and Charcot–Marie–Tooth disease type 1A (Pentao et al. 1992). Chromosomal rearrangements resulting from low copy repeat regions may also be associated with the spinal muscular atrophy phenotype mapped to 5q13 (Theodosiou et al. 1994). Several of the YACs show instability in a region where two groups of low copy repeats, have been mapped close together (see Collins et al. 1995, Fig. 2). The map suggests that the two blocks of repeats are separated by two single-copy landmarks. Surprisingly no YAC was found to contain both blocks of low copy repeats with two large Centre d’Etude du Polymorphisme Humain (CEPH) YACs (yM765E3 and yM841B6) apparently missing either one or both blocks. However, to our knowledge, there is as yet no direct evidence that the repeats described here are involved in the chromosomal rearrangements reported in DiGeorge syndrome or velocardiofacial syndrome.
The difficulties encountered in 22q11 have implications for the human genome project as a whole. Existing large-scale mapping methods, such as landmark content analysis and fingerprinting (in the GGT.2 interval), have been unable to produce contigs across the region. The whole-genome mapping projects (Chumakov et al. 1995; Hudson et al. 1995) have produced contigs in 22q11 that differ from Collins et al. (1995), and discrepancies can often be traced to problems with low copy repeats. The high-resolution YAC and cosmid map of chromosome 16 and 19 contains multigene families and noncoding repetitive sequences that also required special attention during contig assembly (see Olsen et al. 1994; Ashworth et al. 1995; Doggett et al. 1995). The existence of low copy repeats such as those described here may interfere with production of sequence-ready maps and genomic DNA sequence in several regions of the human genome, and may require more detailed mapping methods to be applied.
METHODS
Clone Isolation
YAC clone isolation was described in Collins et al. (1995). Bacterial clones were isolated by hybridization of the GGT1/2 STS (Collins et al. 1992) to gridded arrays of the flow-sorted chromosome 22 cosmid libraries LL22NCO1 (E library) and LL22NCO3 (N library) and a flow-sorted chromosome 22 fosmid library (F library) (Kim et al. 1992) as described in Bentley et al. (1992).
Clone Restriction Digest Analysis
YAC DNA was prepared in agarose (Bentley et al. 1992) and bacterial clone DNA was prepared by alkaline lysis. Human genomic DNA was obtained from Sigma (D-3035: D-3160) or kindly provided by C. Cole (Sanger Centre, Hinxton, UK). A quarter of a plug (∼2.5 μg) of YAC plus yeast DNA, 5 μg of human genomic DNA or 100 ng of bacterial clone DNA in solution was digested overnight with 20–50 units of the appropriate restriction enzyme (NEB) under conditions as recommended by the manufacturers, plus 1 mm of spermidine. DNA was separated on 1% agarose gels, Southern-blotted onto Hybond N membrane (Amersham), and hybridized with the relevant probe incorporating 32P by hexamer (Hodgson and Fisk 1987) or PCR (Bentley et al. 1992) labeling. Southern blot filters were washed twice for 30 min to 0.5× SSC at 65°C. Hybridization signals were visualized by autoradiography.
Amplification and Sequencing of PCR Products
The primer pair described by Courtay et al. (1994) (GGT.AMP1 and 2) was used to amplify the target sequence from bacterial clone colony slurry or extracted YAC DNA in 50 mm KCl, 10 mmTris-HCl (pH 8.3) 1.5 mm MgCl2, 0.05 U/μl ofTaq DNA polymerase (Perkin Elmer), and 0.01 U/μl of Perfect Match (Stratagene) for 30 cycles denaturing at 94°C for 30 sec, annealing at 65°C for 30 sec, and synthesis at 72°C for 30 sec. DNA sequencing was performed with 200 ng of precipitated PCR-amplified products using a Taq FS Terminator Kit (ABI Prism, Perkin Elmer) in cycle sequencing of 95°C for 30 sec, 50°C for 30 sec, and 60°C for 3 min for 25 cycles. Samples were separated on a 4.75% acrylamide gels in a 373 stretch ABI Fluorescent Sequencer and processed with ABI software.
The following primers were synthesised on an ABI 394 DNA/RNA synthesiser according to the manufacturer’s instructions: GGT.AMP.1, AATGGACGACTTCAGCTCTCC; GGT.AMP.2, AGCCGAACCAGAGGTTGTAGA; GGT.AMP.2B, AGAGCGGCTGCTTCCCT; GGT.LK.1, ATCGCGTCCACCTTCATCG; GGT.L.2, CAGAGTCCCCTTCCTGG; GGT.K.2, CCCAAAGTCCTCTTCCTCA. For other primers refer to Collins et al. (1992, 1995).
Digestion of PCR Products
Approximately 30 ng of PCR amplified product (prepared as for sequencing) was digested with 5–20 units of restriction enzyme for 1 hr. Products were separated by electrophoresis on 2.5% agarose gels and visualized with ethidium bromide.
Nomenclature
GGT.1 to GGT.5 refer to intervals defined by the YAC map ofCollins et al. (1995). GGT.A to GGT.D describe specific PvuII restriction fragments derived from clones as defined by experiment (see Table 2). GGT.I and GGT.II refer to the cDNA sequences of (Pawlak et al. 1989). GGT.L is the product of PCR amplification using primers designed from the GGTI cDNA. GGT.K is the product of PCR amplification using primers designed from the GGTII cDNA. The GGT genes 1–3, 6, 11–13 are numbered according to Courtay et al. (1994).
Acknowledgments
We thank M. Ross, C. Cole, and D. Bentley for comments on the manuscript. The chromosome-specific cosmid libraries LL22NCO1 and LL22NCO3 were provided by P. de Jong and were constructed at the Biomedical Science Division, Lawrence Livermore National Laboratories, under the auspices of the National Laboratory Gene Library Project sponsored by the U.S. Department of Energy. The fosmid library was a gift from U.-J. Kim and M. Simon. The data described in this paper are also available through a chromosome 22 database available by ftp fromftp.sanger.ac.uk in directory pub/human/chr22/release-1996-11-25. This work was supported by The Wellcome Trust.
The publication costs of this article were defrayed in part by payment of page charges. This article must therefore be hereby marked “advertisement” in accordance with 18 USC section 1734 solely to indicate this fact.
Footnotes
-
↵1 Corresponding author.
-
E-MAIL jec{at}sanger.ac.uk; FAX 011-44-1223-4949-19.
-
- Received January 23, 1997.
- Accepted March 24, 1997.
- Cold Spring Harbor Laboratory Press


