
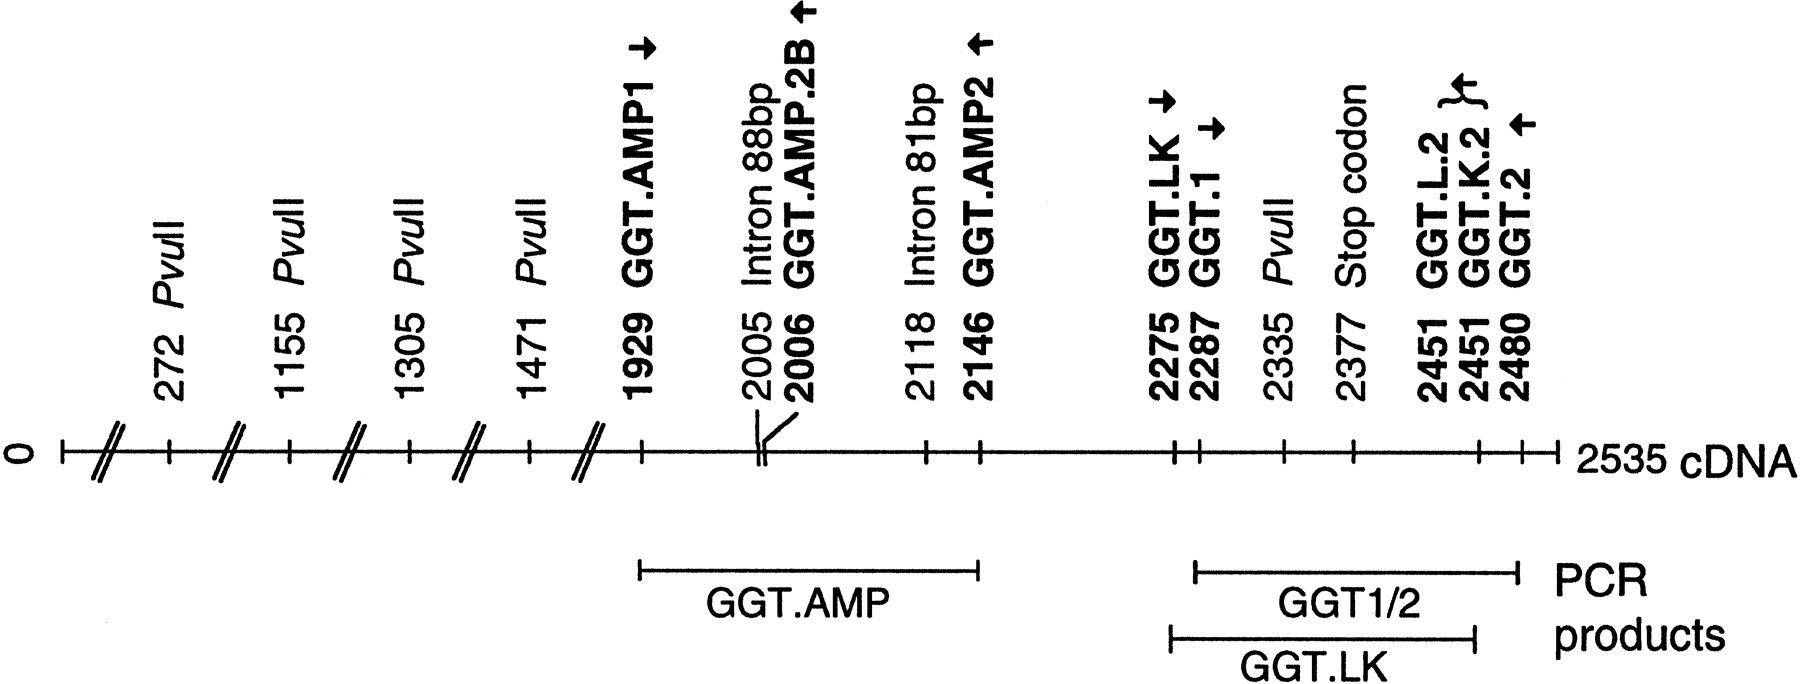
Figure 2.
The cDNA sequence of GGT is shown as a black horizontal line. Diagonal bars indicate where regions have been omitted for display purposes. Numbering is as in the EMBL/GenBank sequence release no. J04131. PCR primers are shown as bold characters with the region amplified marked by a bar below. The 3′ end of each primer is indicated by an arrow. Two intron sequences are indicated at 2005 and 2118 bp.


