
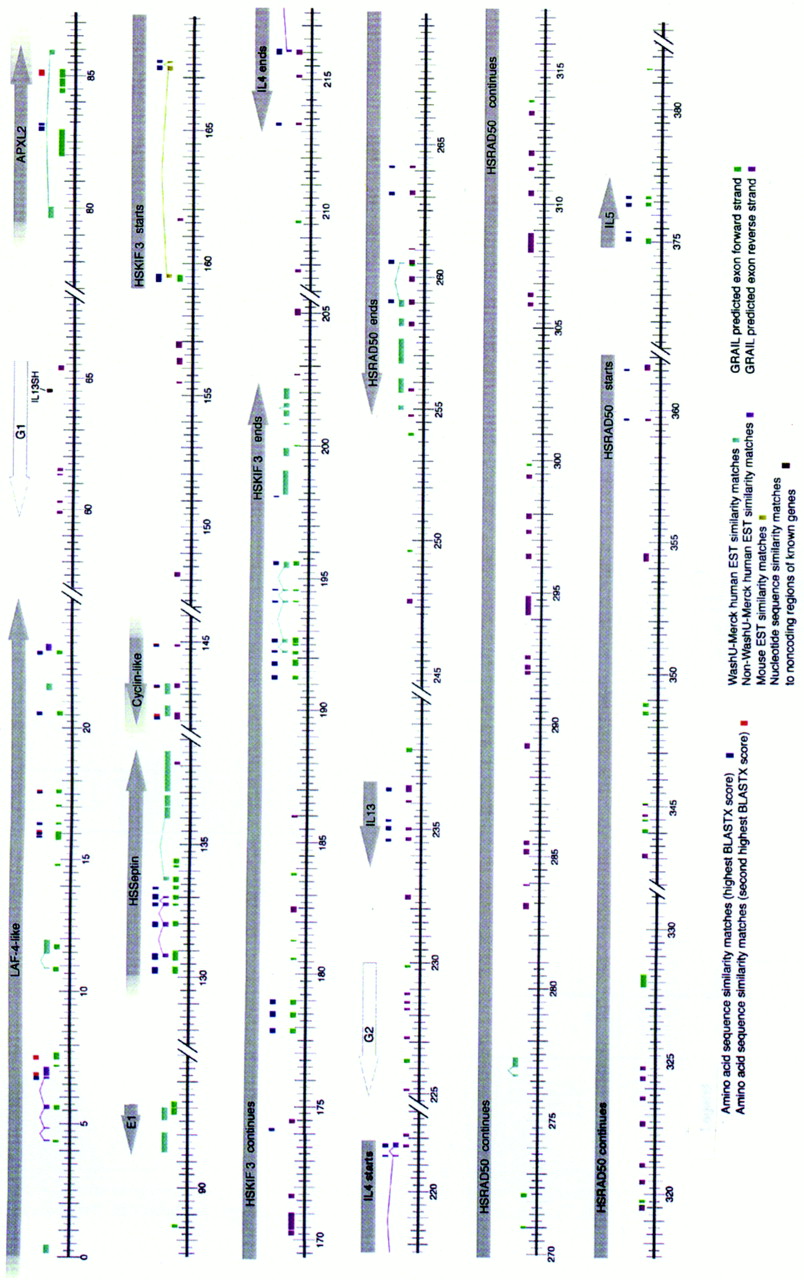
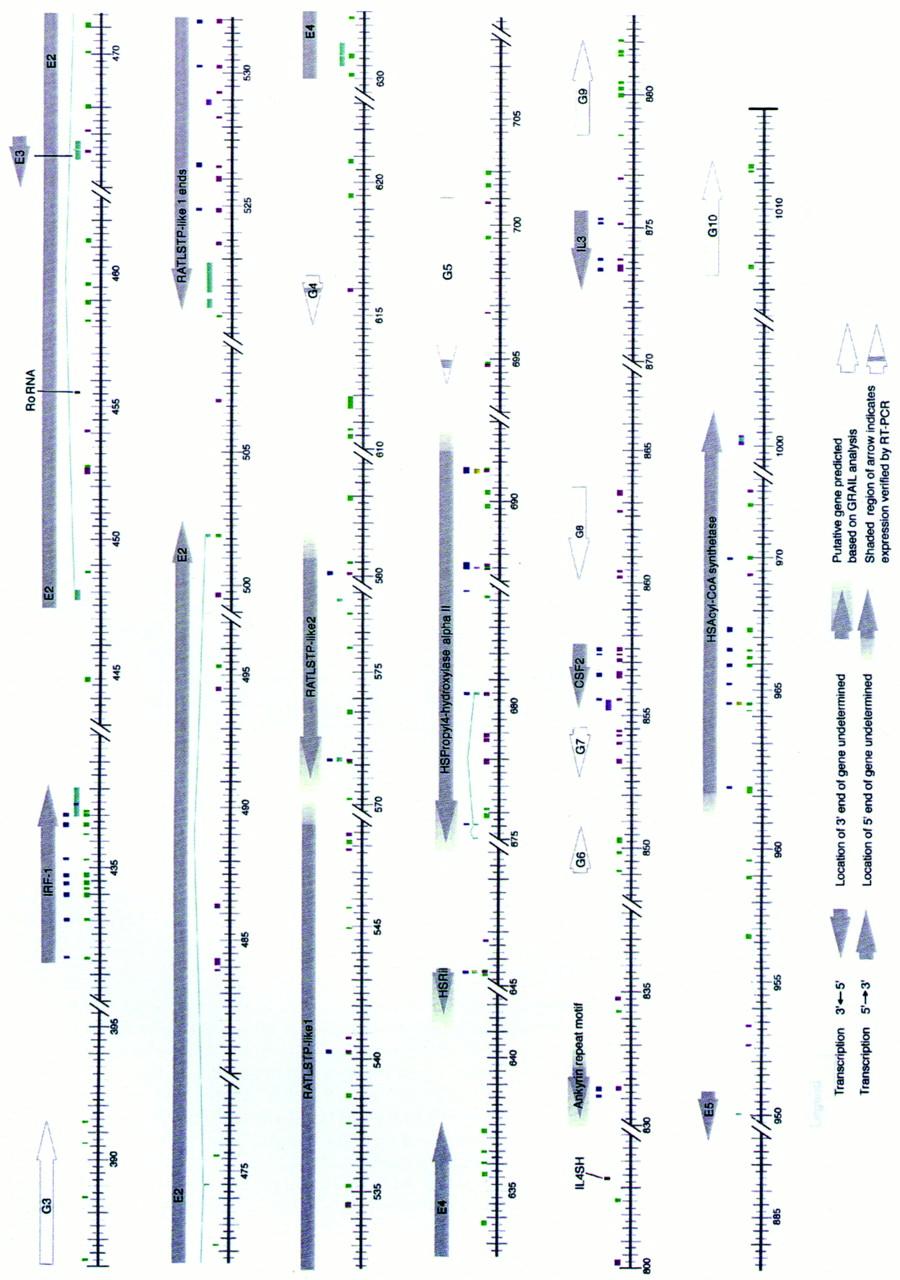
Summary of the computational analysis of the DNA sequence data in the 5q31 region. The scale is in kilobases. The locations and directionality of the putative genes are indicated by arrows and were determined based on database matches and/or GRAIL predictions. Similarity matches to known proteins, ESTs, and to the noncoding regions of known genes are color-coded as described in the key. If the conceptual translation of a putative gene was homologous to more than one protein then the locations of the similarity matches to those proteins with the highest and second highest BLASTX scores are indicated. Matches with human ESTs generated by the WashU–Merck Human EST project are distinguished from matches with ESTs generated by other groups. Only exact human EST matches and mouse EST matches with 85% or greater nucleotide identity are shown. If an EST contained gaps and matched the genomic sequence in more than one place, this was presumed to be attributable to the splicing of an intron and the EST segments were joined together by a line. GRAIL predicted exons in the forward strands are distinguished from those in the reverse strand by their color, as described in the key. If GRAIL predicted exons at the same location in both the forward and reverse DNA sequence strands, those that correspond to the coding strand (i.e., those GRAIL predictions having the same direction as the putative gene) are shown.


