
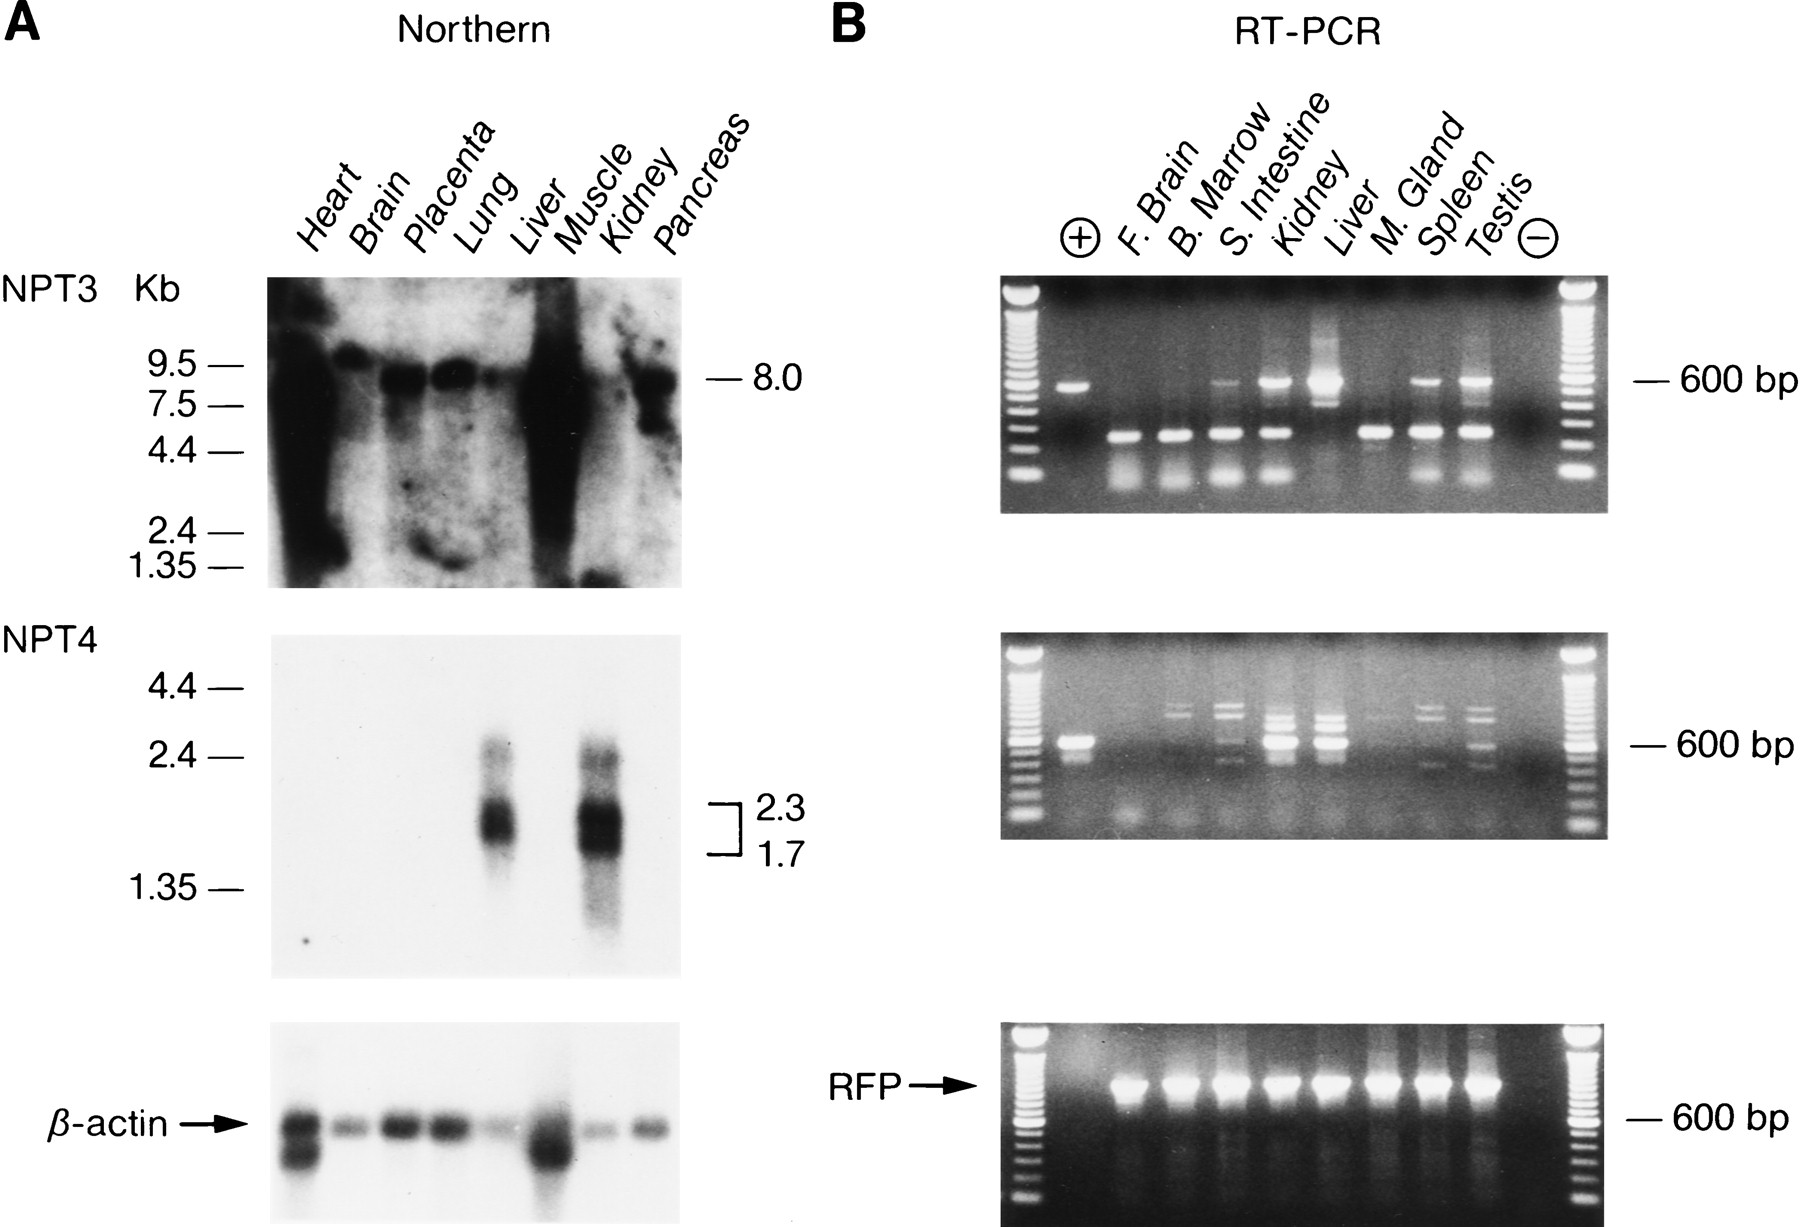
Expression analysis of the NPT3 and NPT4 genes. (A) Northern blot analysis of NPT3 and NPT4. NPT3 is expressed at high abundance in the heart and muscle as a single 8.0-kb transcript. Lesser amounts are found in the other tissues. The expression pattern of NPT4 is more restricted, being found only in the liver and kidney as a mixture of transcripts ranging from 2.3 to 1.7 kb. (B) RT–PCR analysis of theNPT3 and NPT4 genes. Included in the (+) lane are the NPT3 and NPT4 cDNA positive controls. TheNPT3 gene is expressed as the proper size PCR fragment in the small intestine, kidney, liver, spleen, and testis. A smaller fragment is detected in all tissues with the exception of the liver. The no-DNA control lane (−) is negative. NPT4 is expressed as the proper size fragment in the small intestine, kidney, liver, and testis. Larger and smaller size fragments are found in all other tissues with the exception of the brain. For both genes, these different size fragments may indicate alternative splice events. The no-DNA control lane (−) is negative. The RFP primers show the integrity of the cDNA.


