
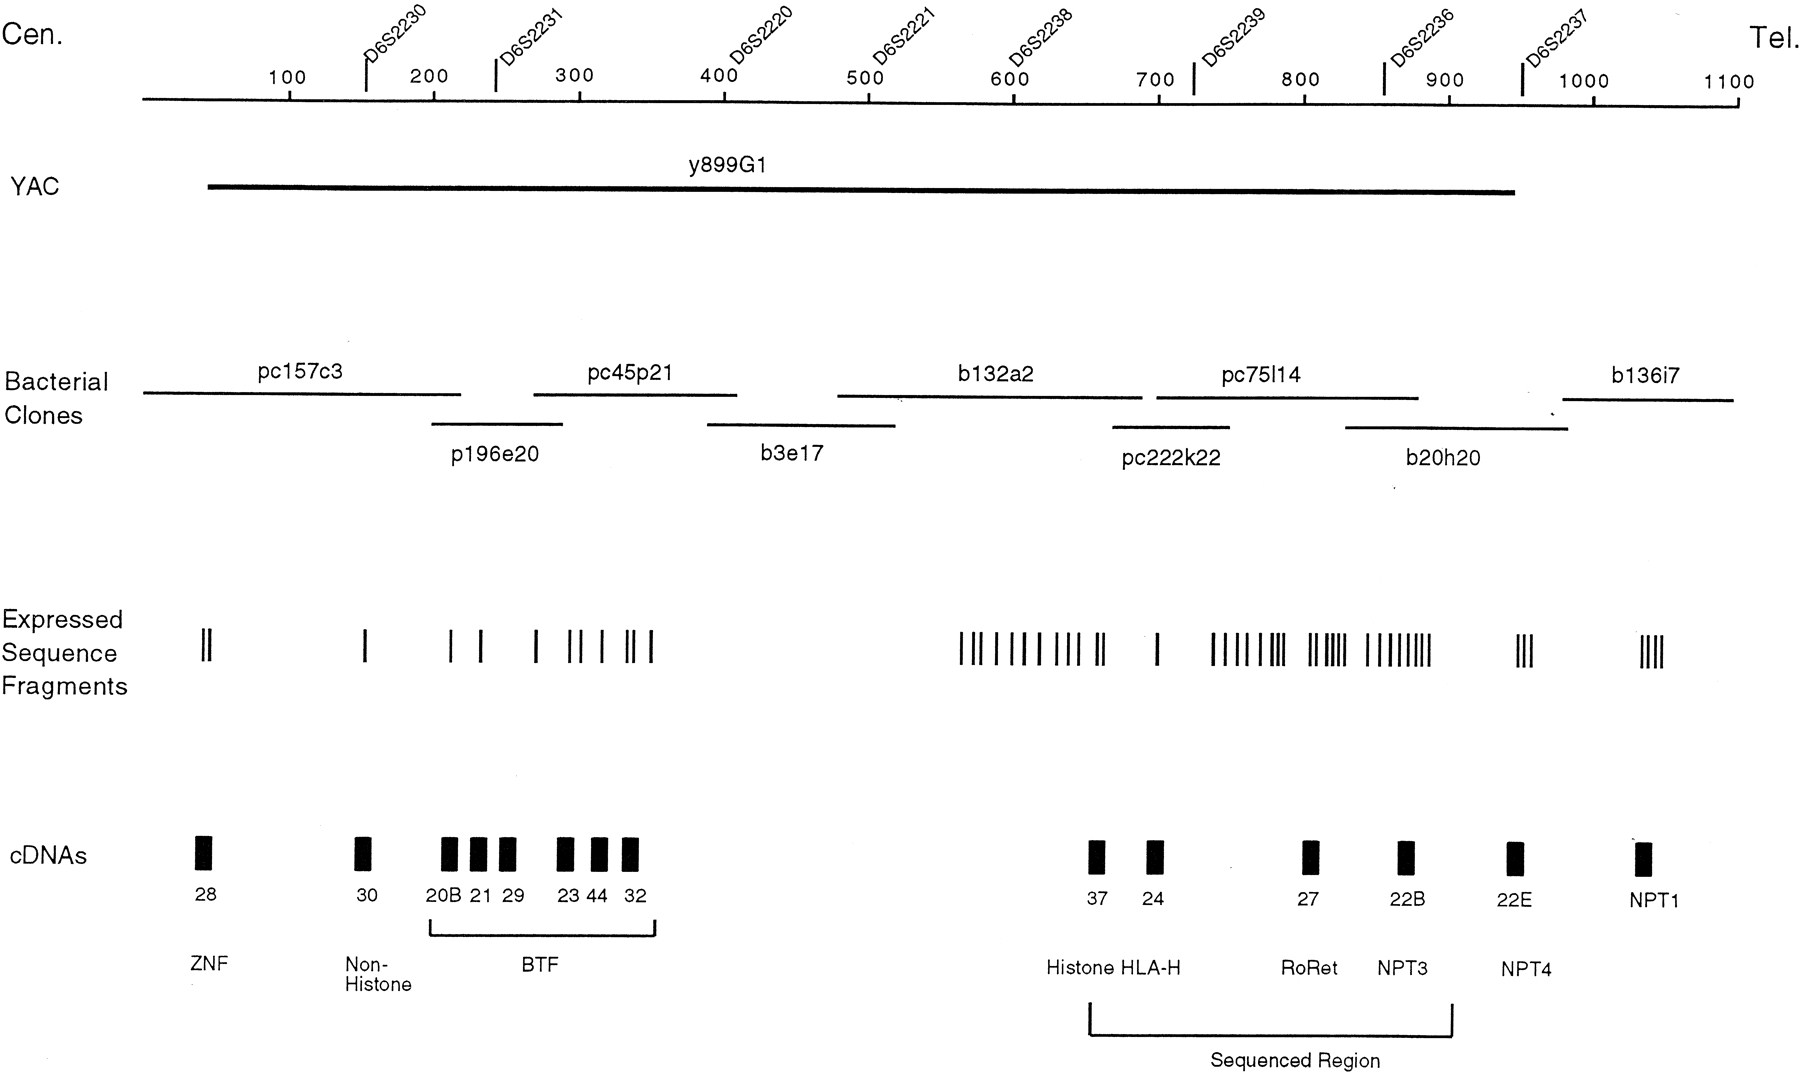
Combination genetic, physical, and transcription map of the HH candidate gene region. The first line shows the relative positions of selected genetic markers that define the HH region. The bold line below represents the YAC clone used in the direct selection experiments. The order and positions of the bacterial clones used in the exon trapping and sample sequencing are indicated under the YAC. The thin bars under the bacterial clones represents the approximate locations of the subset of ESFs that mapped to the contig. The thicker bars show the location of a subset of the cDNAs cloned. Two regions are bracketed: the butyrophilin family of genes (BTF), and the region where complete genomic sequencing was carried out.


