
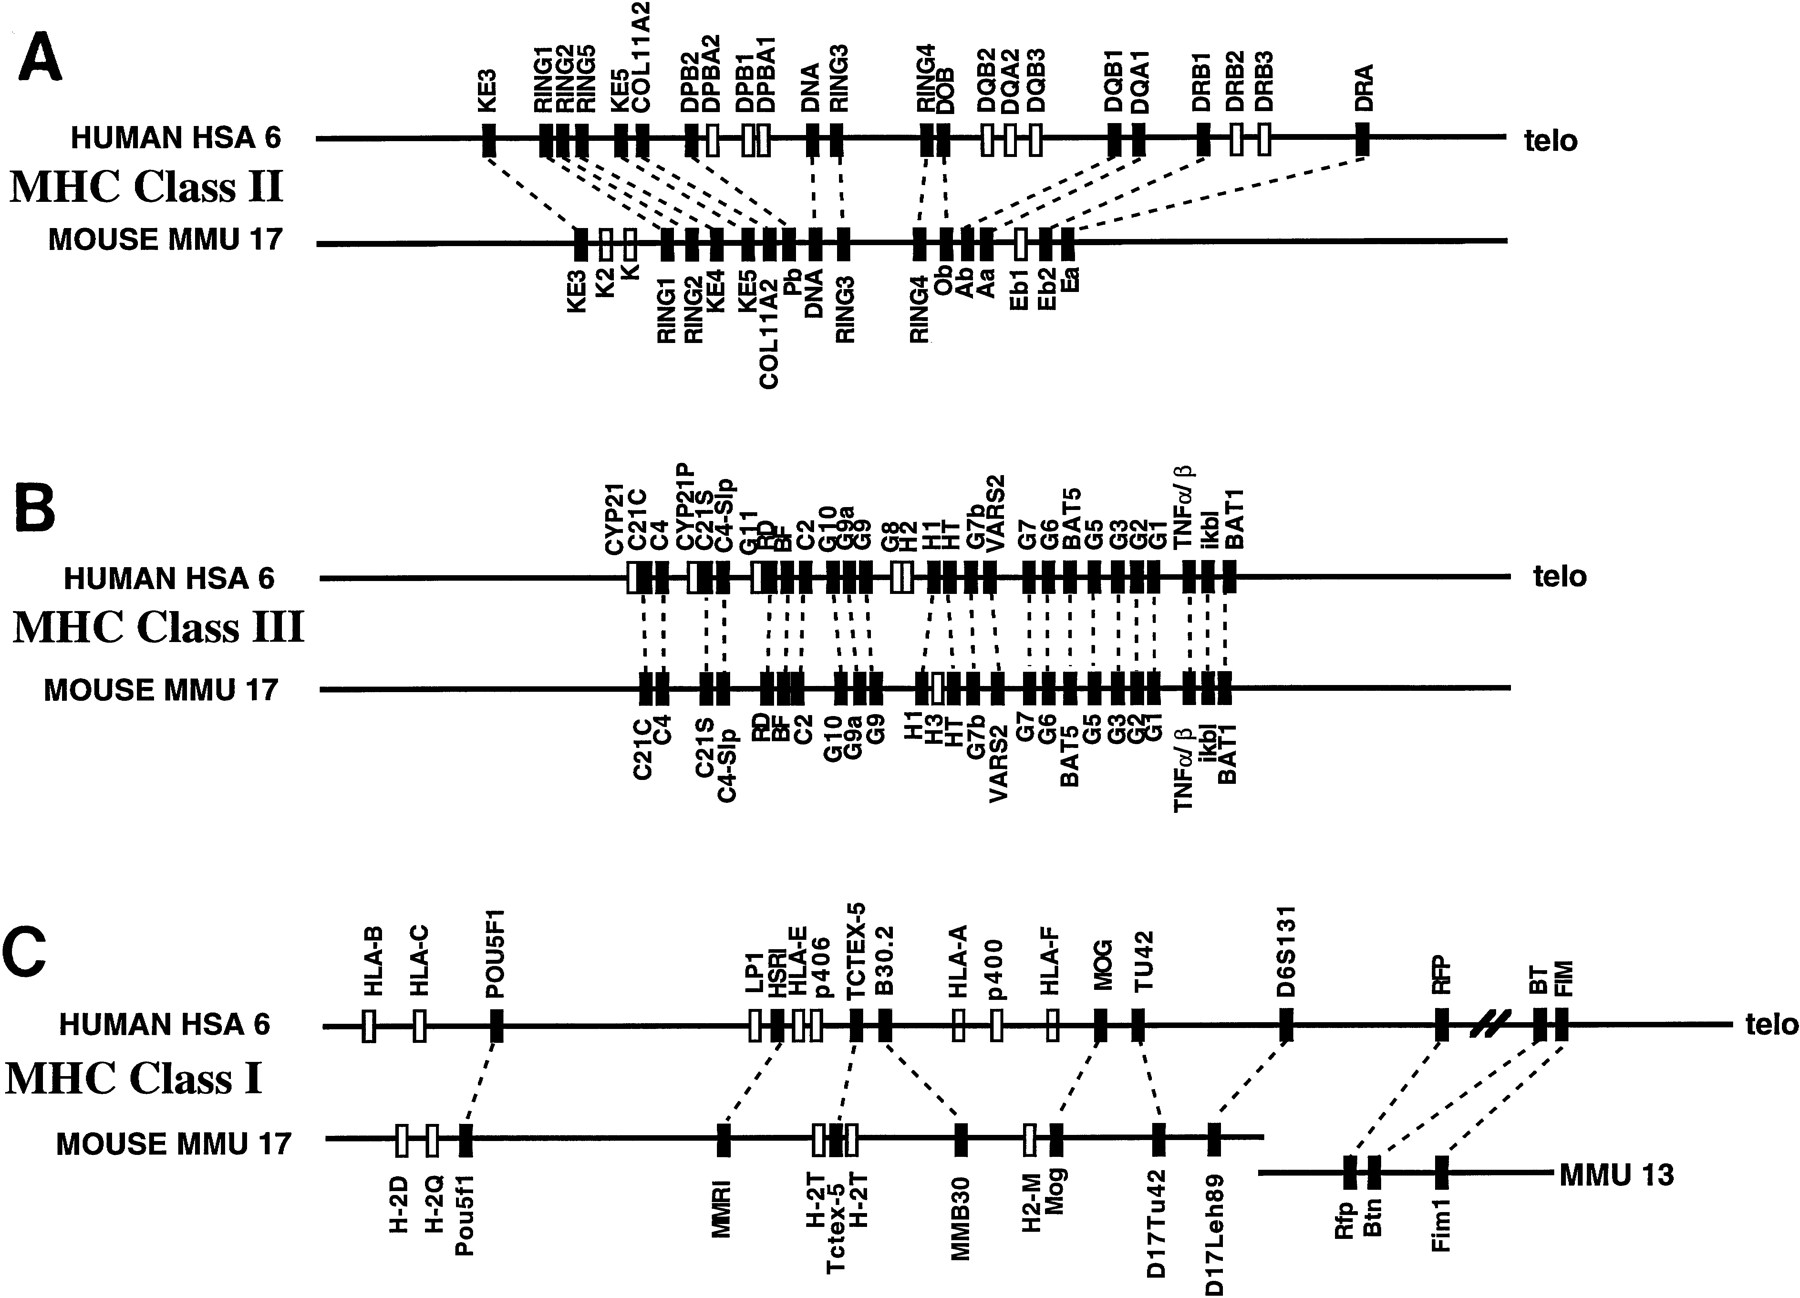
Figure 3.
Comparative map of human and mouse MHC regions. Comparative alignment of the class II (A), class III (B), and class I (C) gene regions of the MHC regions of human chromosome 6 and mouse chromosome 17. Data are taken from published studies, as described in the text (Hansen and Trowsdale 1990; Amadou et al. 1995;Peelman et al. 1996). Conserved sequences are indicated by a solid box, whereas human genes that do not detect true orthologs in mouse, or vice versa—e.g., representing recent gene duplications or highly diverged but functionally homologous sequences—are indicated by open boxes. Orthologous gene pairs are connected by broken lines.


