
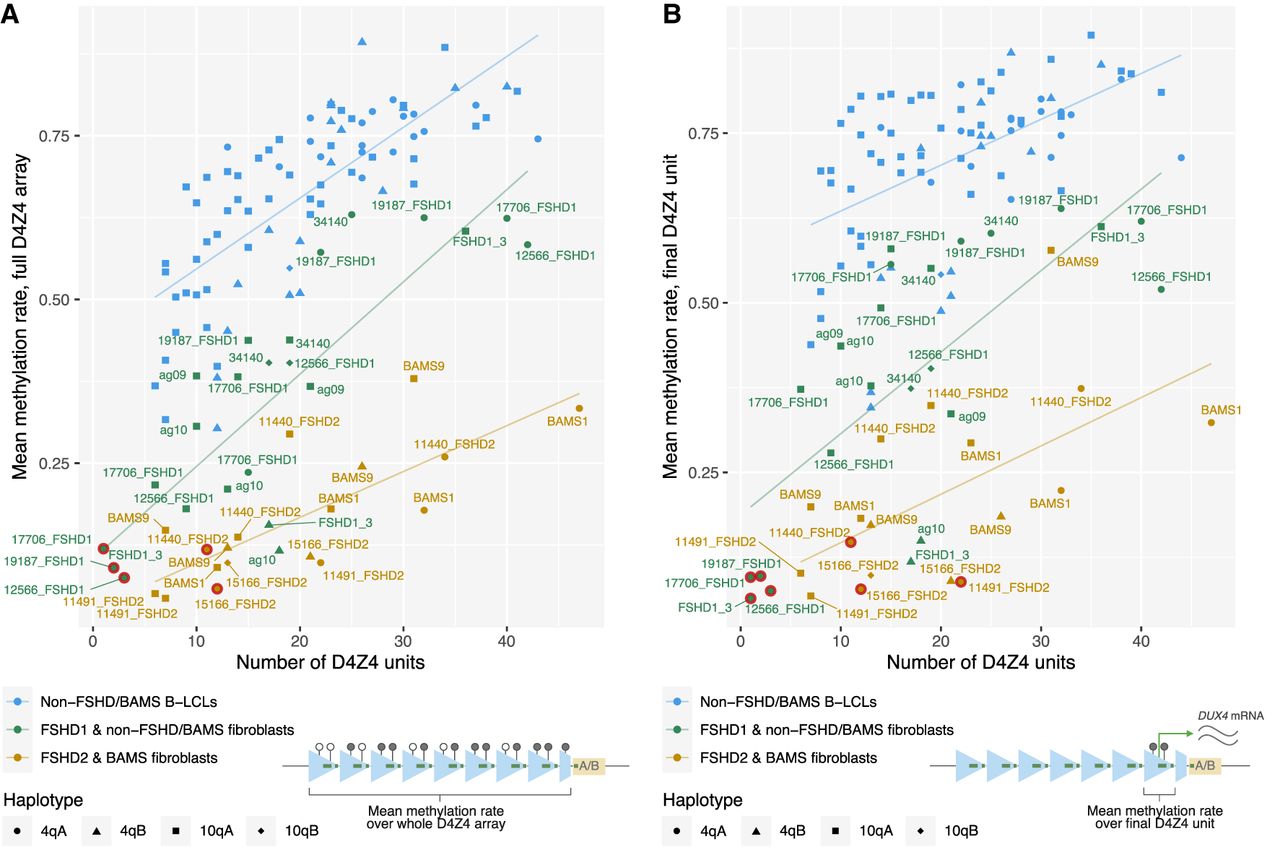
Correlation of allelic D4Z4 methylation levels with the number of repeat units. Mean methylation rates of individual alleles across (A) the full 4q/10q D4Z4 arrays or (B) the final D4Z4 unit against the number of D4Z4 units, plotted for alleles from SMCHD1-wild-type fibroblasts (FSHD1 and non-FSHD/BAMS), pathogenic-SMCHD1-variant fibroblasts (FSHD2 and BAMS), and 30 B-lymphoblastoid cell lines (B-LCLs) from the 1000 Genomes Project (Gustafson et al. 2024). Sample 34,140, initially clinically diagnosed as FSHD2, was included in the “non-FSHD/BAMS” group based on the lack of pathogenic SMCHD1, LRIF1, or DNMT3B variants and overall methylation profile. Mean methylation rate was calculated as the total number of methylated CpGs from all reads/the total number of methylated + unmethylated CpGs from all reads, across the defined regions. Regression lines were plotted for each group of samples. Alleles presumed to be the pathogenic alleles for each of the FSHD patients are indicated with red rings. (A) Pearson and Spearman’s correlation coefficients for FSHD1 and non-FSHD/BAMS fibroblasts, FSHD2 and BAMS fibroblasts, and B-LCLs were 0.844 and 0.826, 0.757 and 0.742, and 0.746 and 0.798, respectively. (B) Pearson and Spearman’s correlation coefficients for FSHD1 and non-FSHD fibroblasts, FSHD2 and BAMS fibroblasts, and B-LCLs were 0.701 and 0.732, 0.583 and 0.607, and 0.531 and 0.552, respectively.


