
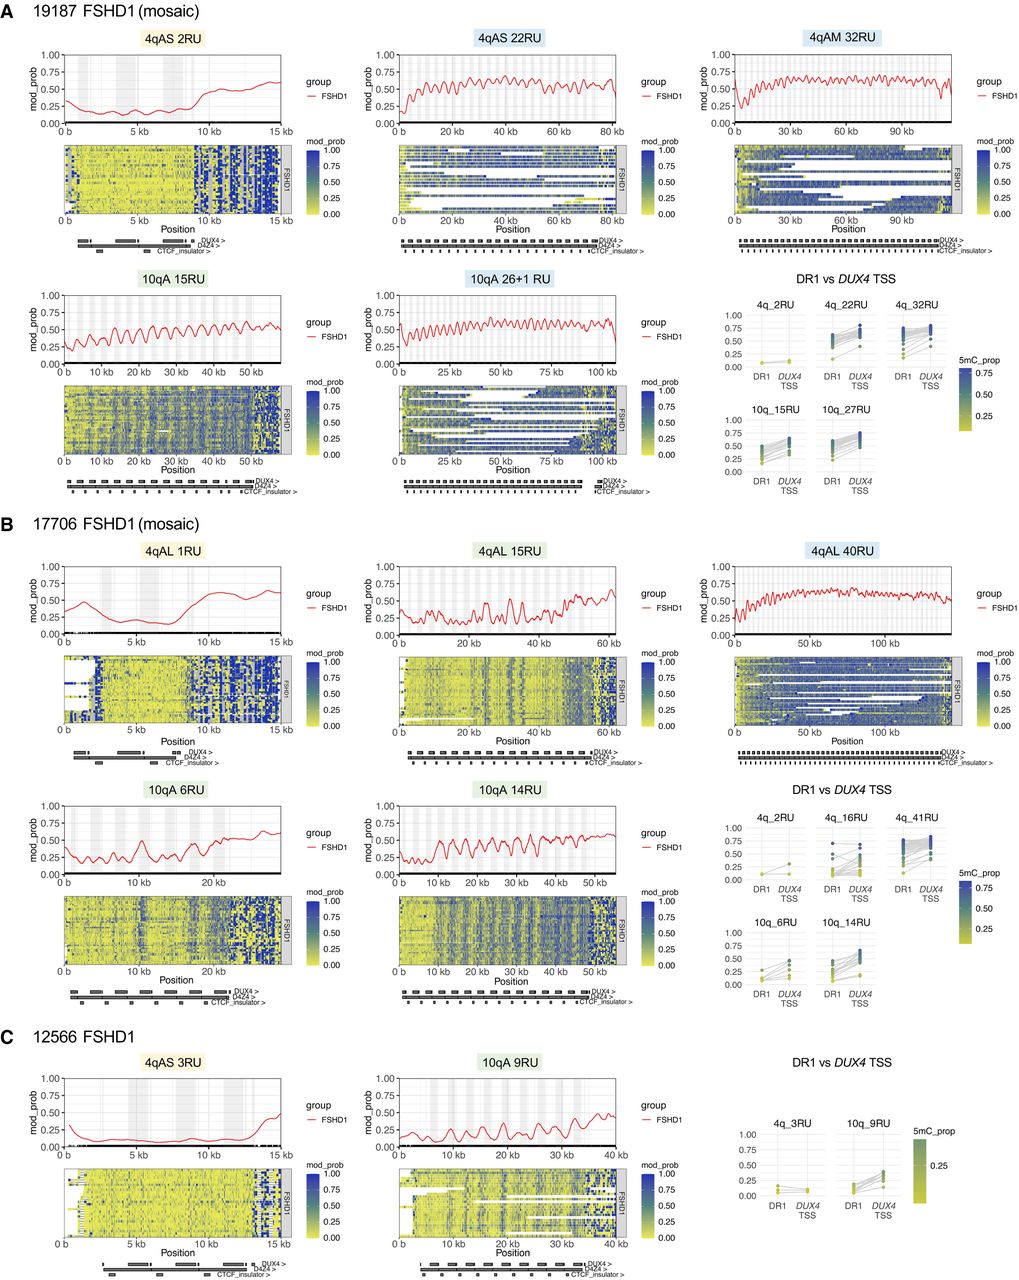
Allele-specific, array-wide D4Z4 methylation profiles for FSHD1 fibroblasts from Cas9-targeted sequencing. Single-molecule and smoothed methylation plots for 4q and 10q D4Z4 alleles from the FSHD1 samples (A) 19,187, (B) 17,706, and (C) 12,566, generated using NanoMethViz (Su et al. 2021, 2025). The locations of DUX4 exons are shaded in gray on the smoothed methylation plot. Annotations for D4Z4 repeat units, CTCF insulator regions, and DUX4 exons are shown below each plot. Mean methylation rates over the DR1 region (positions 563–814 of the D4Z4 KpnI-KpnI unit) (Hartweck et al. 2013) and DUX4 transcription start site (TSS) region (−200 to +200 with respect to the TSS at position 1688 of the D4Z4 KpnI-KpnI unit) within each D4Z4 unit were also plotted for each allele. Points for DR1 and DUX4 TSS regions from the same D4Z4 unit are connected by gray lines.


