
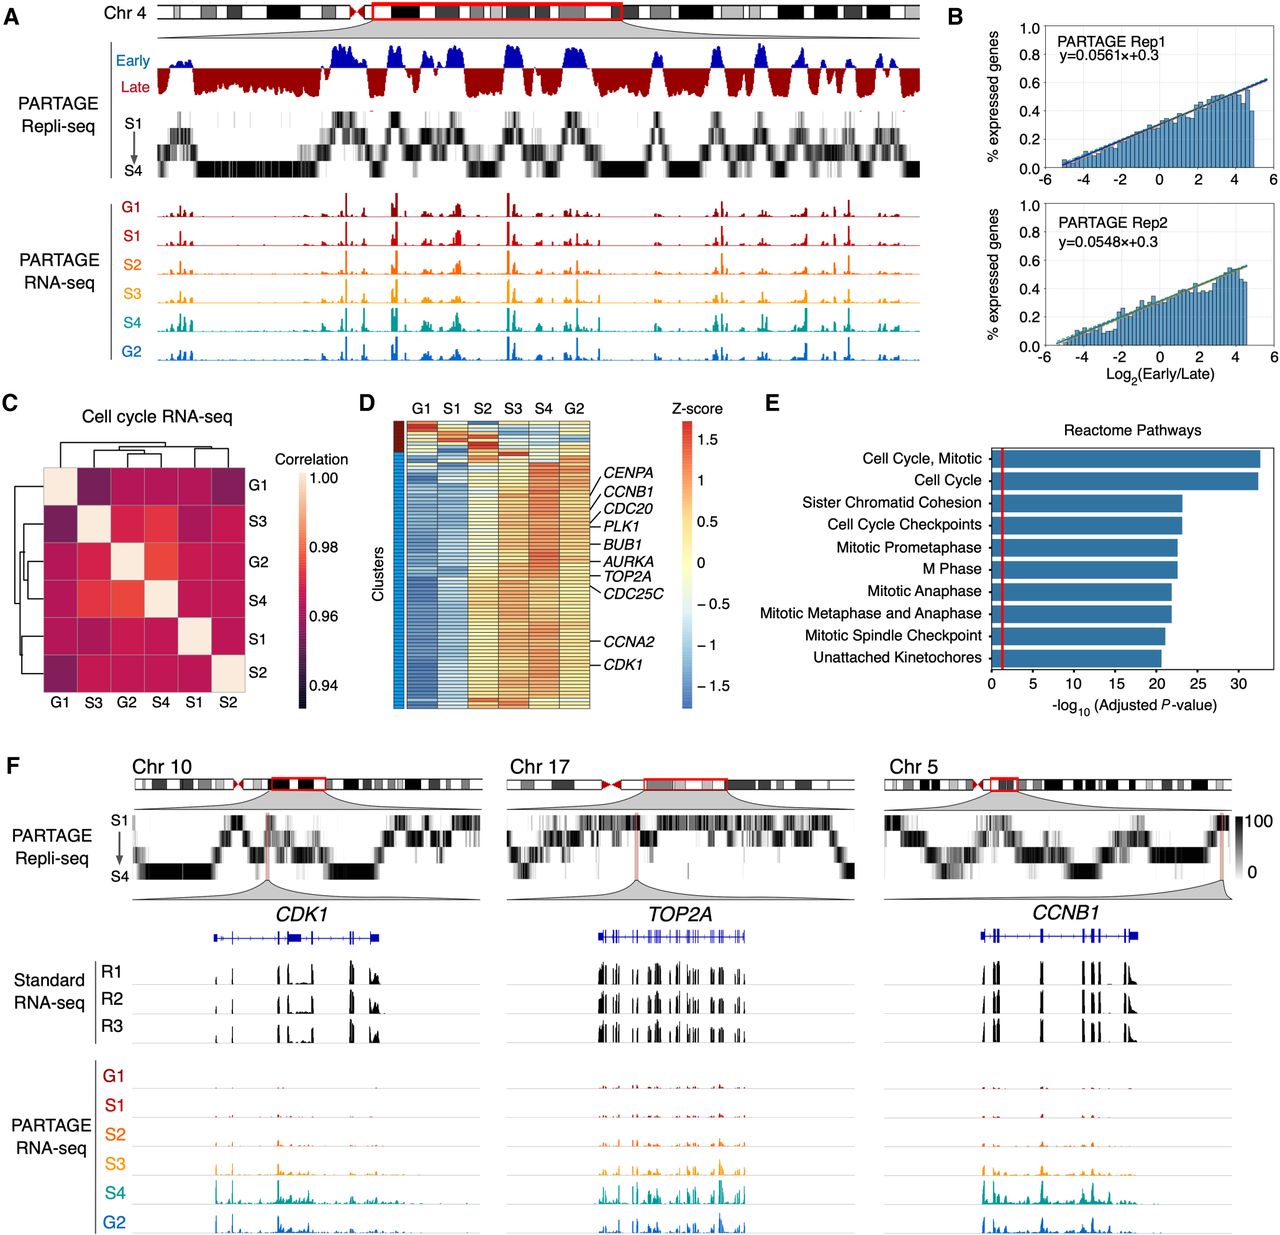
Cell cycle regulation of DNA replication and gene expression. (A) Exemplary genomic locus from Chromosome 4 showing enrichment of gene expression at the early replicating regions. Collapsed E/L ratios from PARTAGE Repli-seq data, PARTAGE multifraction signals, and coverage RNA-seq tracks are shown. (B) Genome-wide correlation between replication timing and gene expression. Expressed genes were identified (threshold of ≥2 log2TPM) and sorted by their RT. The y-axis represents the percentage of expressed genes within each bin. Logistic regression (inner line) and 95% confidence intervals (outer lines) display the correlation strength. Two PARTAGE replicates are shown. (C) Genome-wide correlation of transcriptome programs across the cell cycle. Average TPMs were calculated per cell cycle stage after batch correction (ComBat 2.0), and gene expression values ≥ 0.5 log2TPM in at least three cell cycle stages were used. Pairwise Pearson's correlation was performed with hierarchical clustering based on correlation distance (1 − r). Note that the correlation scale is confined to a narrow range near 1.0 highlighting minor differences between cell cycle stages. (D) Heat map and clustering analysis of variable genes during the cell cycle. Genes are represented by row-wise z-scored log2(TPM) values and clustered by k-means (k = 2). Only genes expressed in ≥2 cell cycle stages and with ≥4× Δ log2TPM were considered. (E) Reactome ontology analysis of the major cluster (blue) is shown. (F) Exemplary chromosome regions harboring variable genes that are induced during cell cycle progression (CDK1, TOP2A, and CCNB1).


