
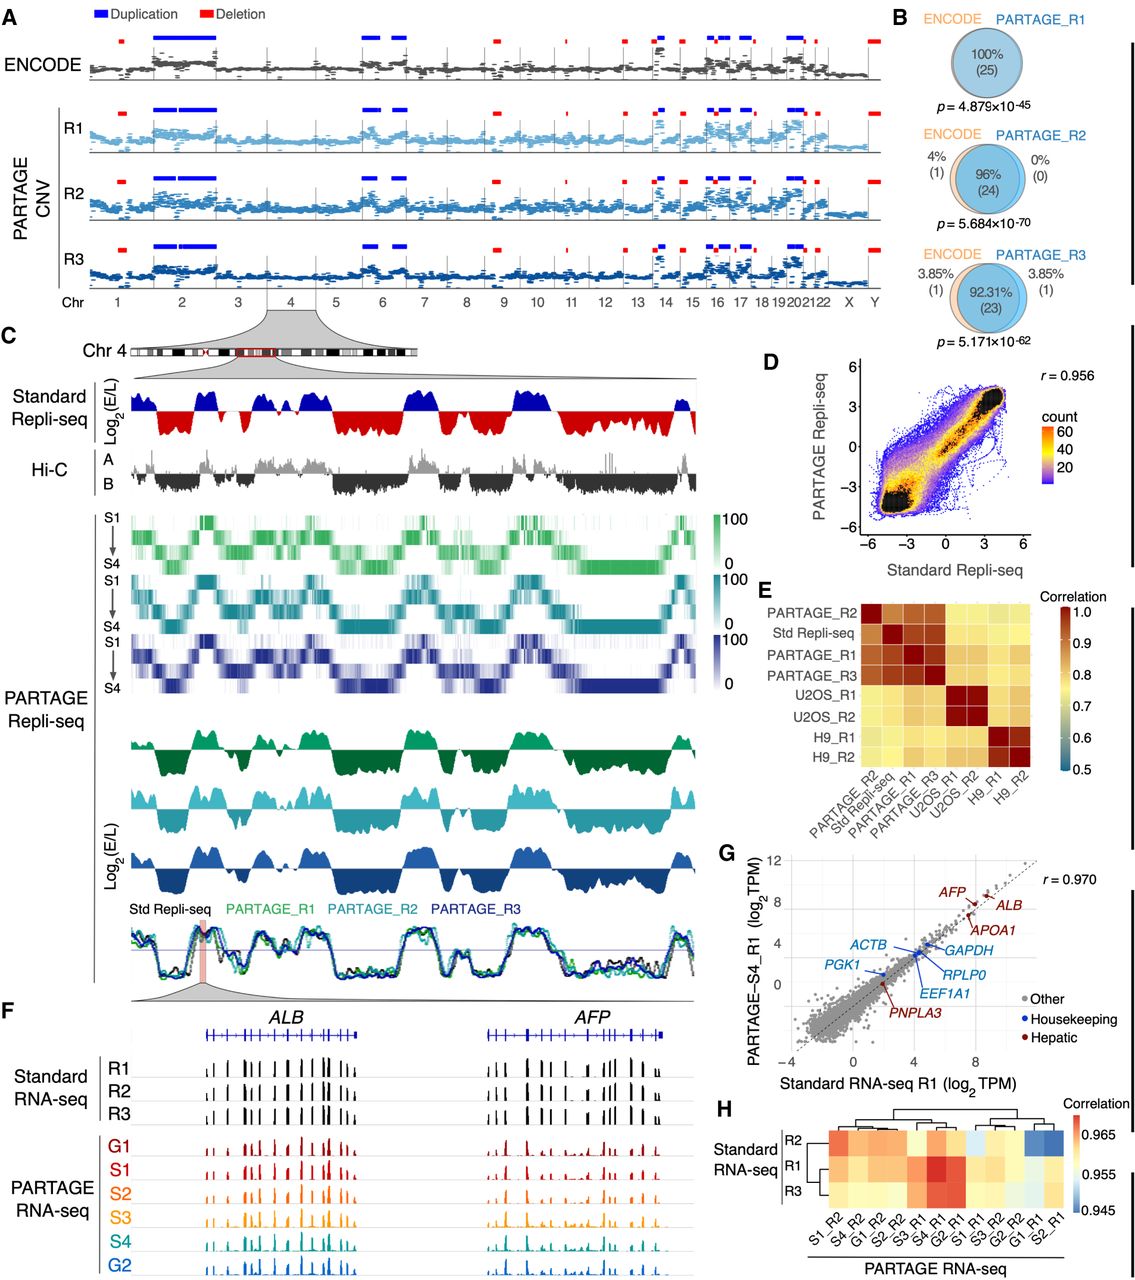
PARTAGE accurately profiles CNV, RT, and transcriptomes. (A) Comparative CNV analysis. CNV profiles derived from ENCODE high-coverage WGS (60× coverage; top track) and from PARTAGE (∼0.5× coverage; three independent replicates) using CNVpytor (see Methods). CNV segments identified in the ENCODE data set (n = 25 events) are shown as duplications (blue) and deletions (red) and were used as a reference. PARTAGE CNV calls are also shown. (B) Overlap of CNV calls between ENCODE and PARTAGE replicates was quantified. PARTAGE correctly detected 92%–100% of the ENCODE CNV events across replicates. The statistical significance of the overlap between ENCODE and PARTAGE CNVs was assessed using ProOvErlap (see Methods). (C) Comparative analysis of standard and PARTAGE Repli-seq data. Standard Repli-seq is shown as log2(E/L) ratio signals. Multifraction Repli-seq is shown in distinct heat map colors per replicate. Signals are normalized counts against G1 per 20-kb bins. Collapsed E/L log2 ratios were calculated from PARTAGE multifraction Repli-seq RT to obtain RT profiles directly comparable to standard E/L Repli-seq. (D) Scatterplot of PARTAGE (y-axis) versus standard (x-axis) Repli-seq data. (E) Genome-wide correlation between a PARTAGE and standard Repli-seq. Genome-wide RT data in 20-kb bins were used. RT from stem cells (H9) and cancer cells (U2OS) were included as a comparison. (F) PARTAGE and standard RNA-seq coverage tracks at the albumin locus showing expression patterns of the hepatic genes ALB and AFP. Raw coverage normalized for sequencing depth was used. (G) Gene-by-gene scatterplots on batch-corrected expression values (log2TPM). Standard RNA-seq (x-axis) versus PARTAGE RNA-seq (y-axis) is shown. Housekeeping genes (blue) and hepatic markers (red) are highlighted; all other genes are gray. (H) Genome-wide cross-protocol concordance between a PARTAGE and standard RNA-seq transcriptomes. Pearson's correlation among all samples, computed on batch-corrected log2TPM values, and clustered by Euclidean distance, is shown. Note that the correlation map is confined to a narrow range near 1.0 reflecting strong similarity across transcriptomes.


