
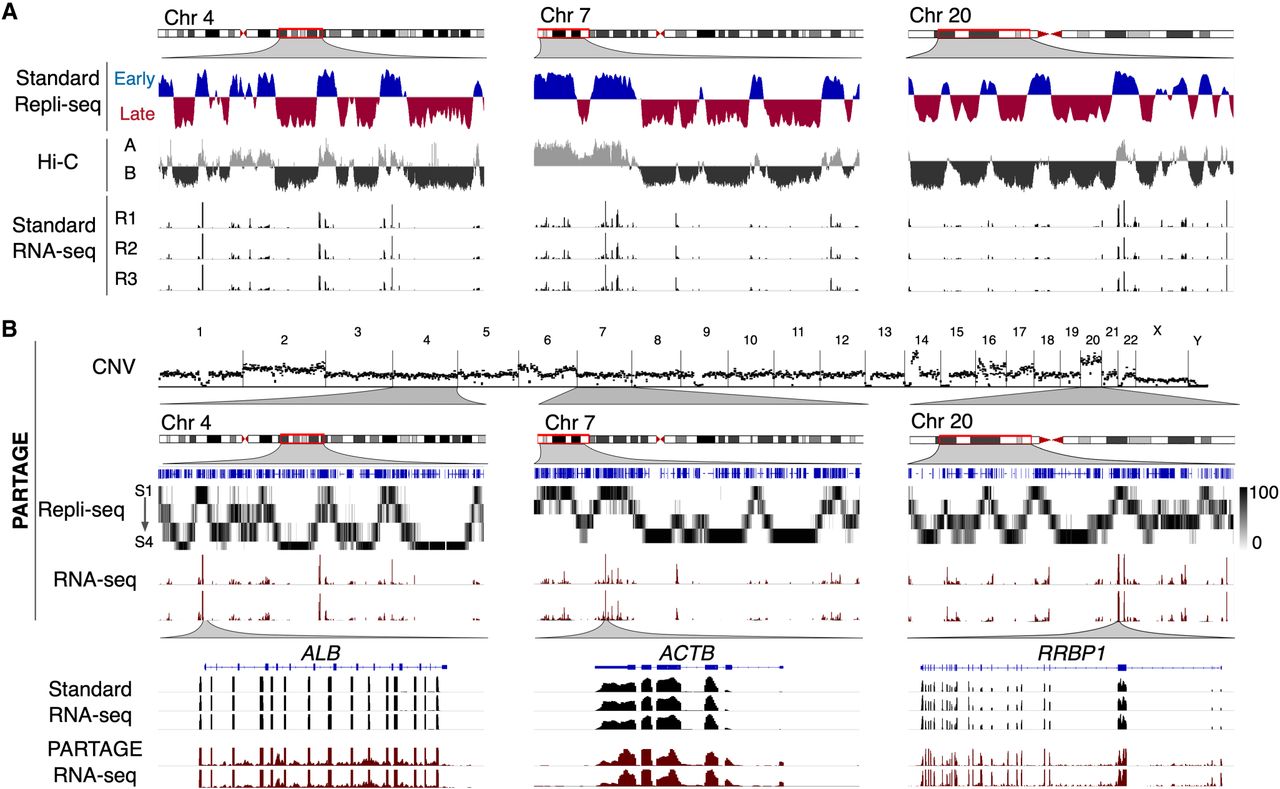
PARTAGE captures CNV, RT, and transcriptomes from the same samples. (A) Standard omics analysis generated from HepG2 cells. Three exemplary chromosomal regions are shown. Standard Repli-seq, chromosome confirmation capture (Hi-C), and RNA-seq were performed from separate sample batches of HepG2 cells. (B) PARTAGE simultaneous mapping of CNV, RT, and transcriptome from HepG2 nuclei. CNV was calculated from the sequencing reads obtained from G1 cell populations. Sequencing reads normalized for depth and per 1-Mb bin are shown. PARTAGE Repli-seq was performed using multifraction RT analysis. Heat map signals of G1-normalized reads are shown per fraction (S1–S4). RNA-seq coverage tracks are shown for the same chromosomal regions. Bottom tracks show a comparison between standard and PARTAGE RNA-seq signals zoomed in on hepatic-specific (ALB) and housekeeping genes (ACTB and RRBP1).


