
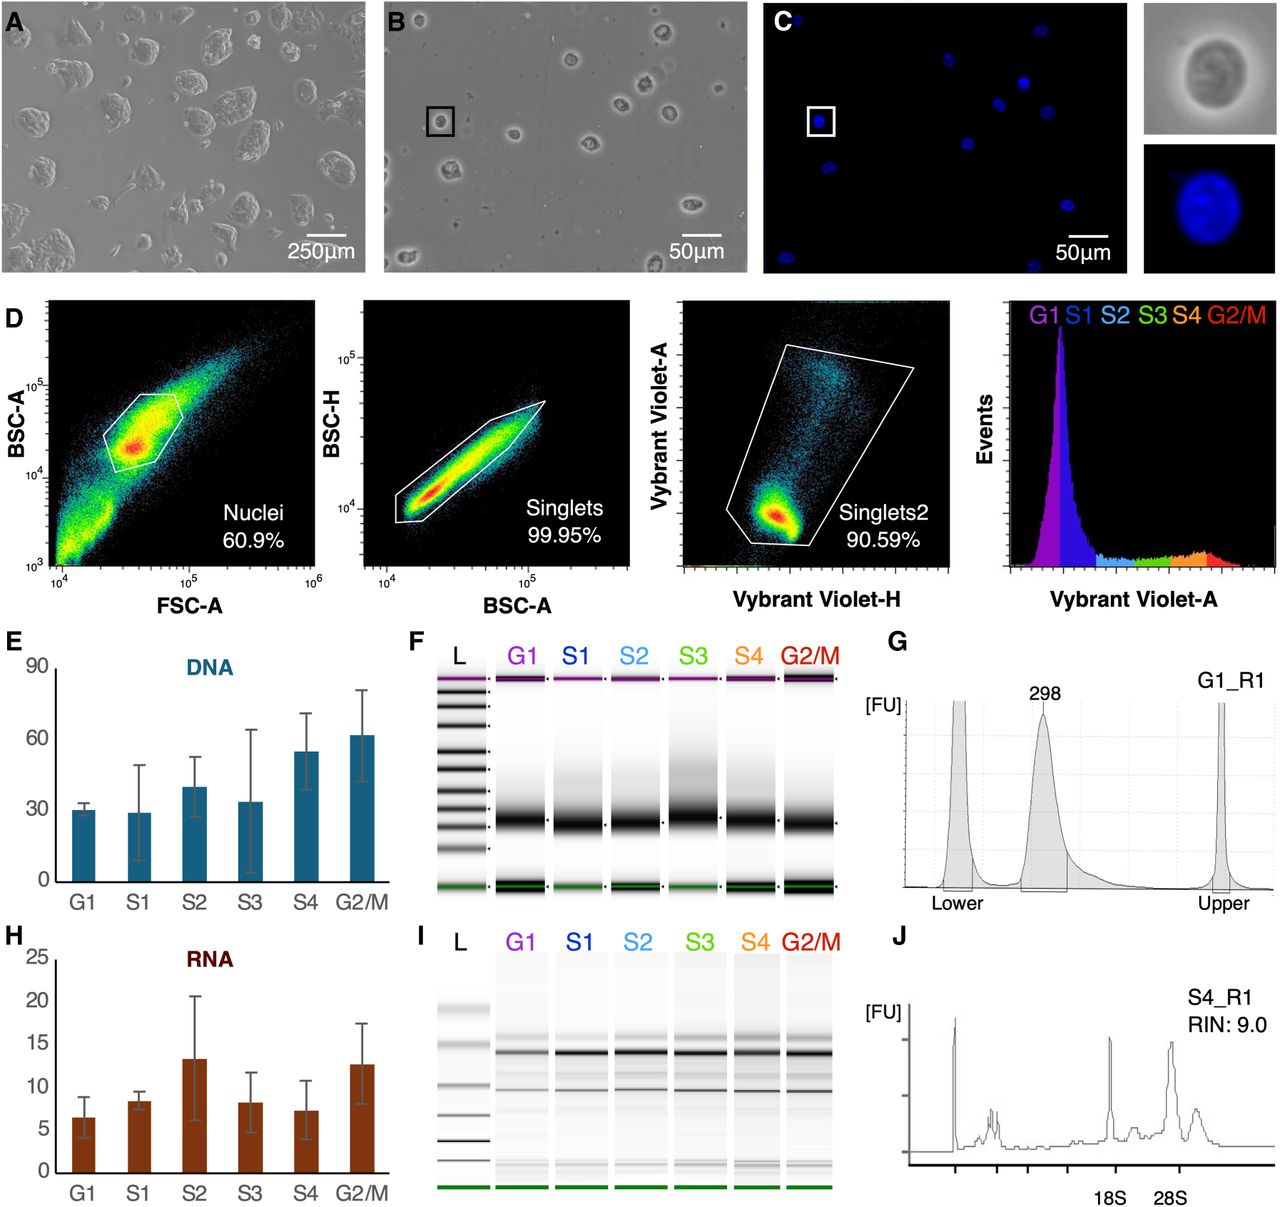
PARTAGE sample preparation. (A) HepG2 cells in culture. (B) Purified intact nuclei. (C) Nuclei staining with Vybrant DyeCycle Violet for accurate DNA content estimation. Magnification of a single nucleus is shown. (D) Flow cytometry and gating strategy. Single nuclei were identified, and gates were established to purify cell populations across the cell cycle: G1, S1, S2, S3, S4, G2/M. Twenty thousand nuclei were collected per fraction, and three independent biological replicates were processed. (E) DNA yields (total ng) obtained from each sorted population. (F) Integrity analysis and size distribution of purified and fragmented genomic DNA. (G) Electropherogram of purified and fragmented genomic DNA. (H) RNA yields copurified with the DNA (total ng) from the sorted cell populations. (I) RNA integrity analysis. (J) Exemplary electropherogram of purified RNA demonstrating RNA integrity (RIN = 0.90).


