
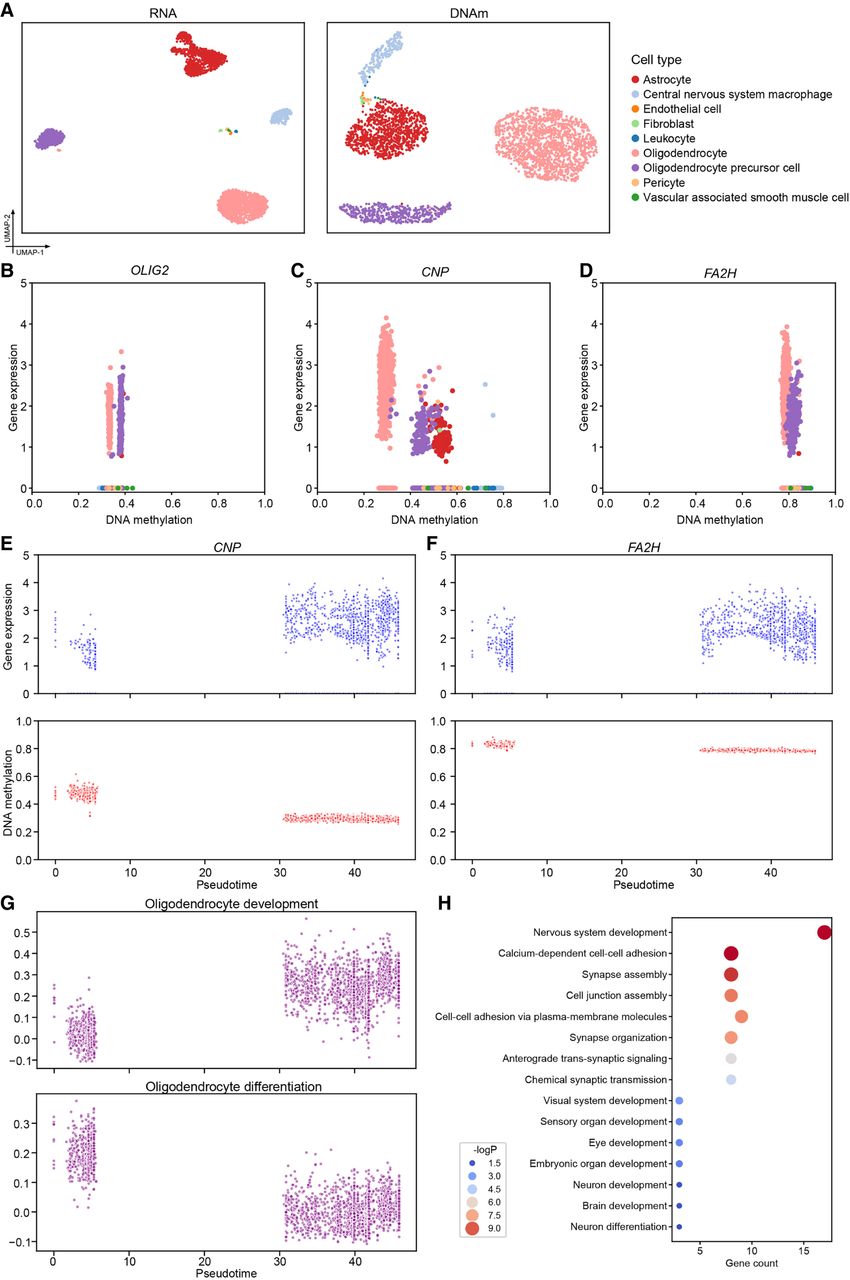
Transcriptomic–epigenetic dynamics in the oligodendrocyte lineage. (A) UMAP visualization of RNA and predicted DNAm profiles on the HumanBrainB data set. (B–D) Scatter plots showing the relationship between gene expression and promoter-proximal DNA methylation levels across cell types for three key oligodendrocyte lineage genes: OLIG2, CNP, and FA2H. (E,F) Pseudotime dynamics of CNP and FA2H gene expression and promoter-proximal DNA methylation along the oligodendrocyte lineage trajectory. (G) Pseudotime-based module scores of two biological processes: oligodendrocyte development and oligodendrocyte differentiation. (H) Bubble plot showing enriched GO terms among genes with significant pseudotime-associated promoter-proximal DNA methylation.


