
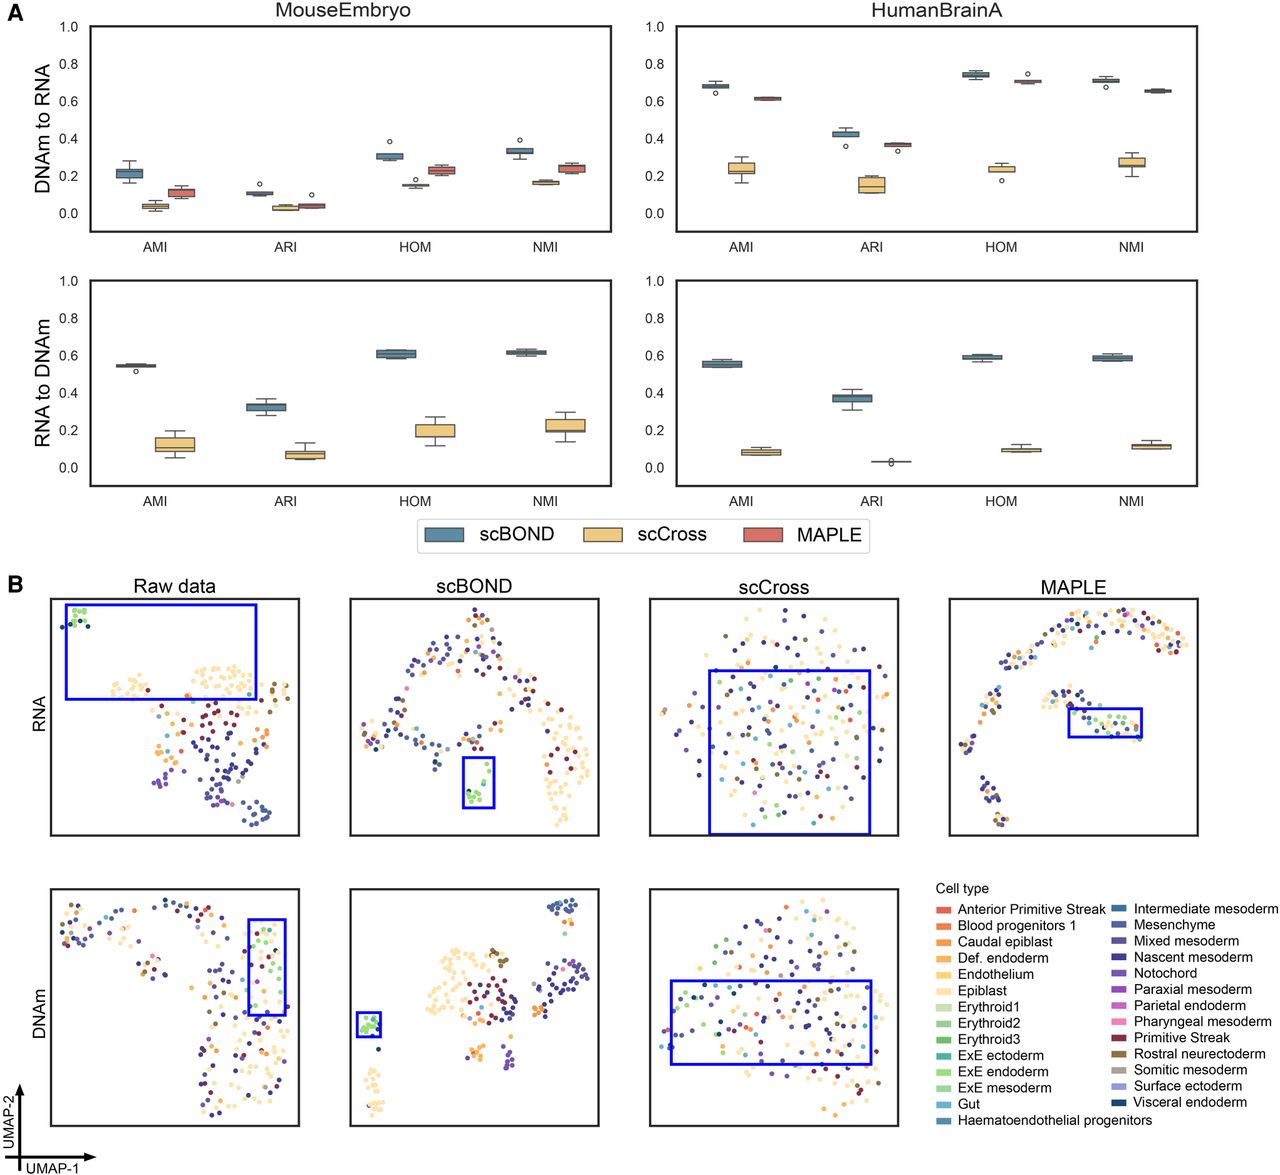
Figure 2.
Benchmarking the cross-modal translation performance of scBOND. (A) Quantitative comparison of scBOND, scCross, and MAPLE on the MouseEmbryo data set and the HumanBrainA data set. Boxplots show four clustering evaluation metrics for both translation directions (DNAm to RNA and RNA to DNAm). (B) UMAP visualizations of the raw and translated profiles from the first test fold of the MouseEmbryo data set.


