
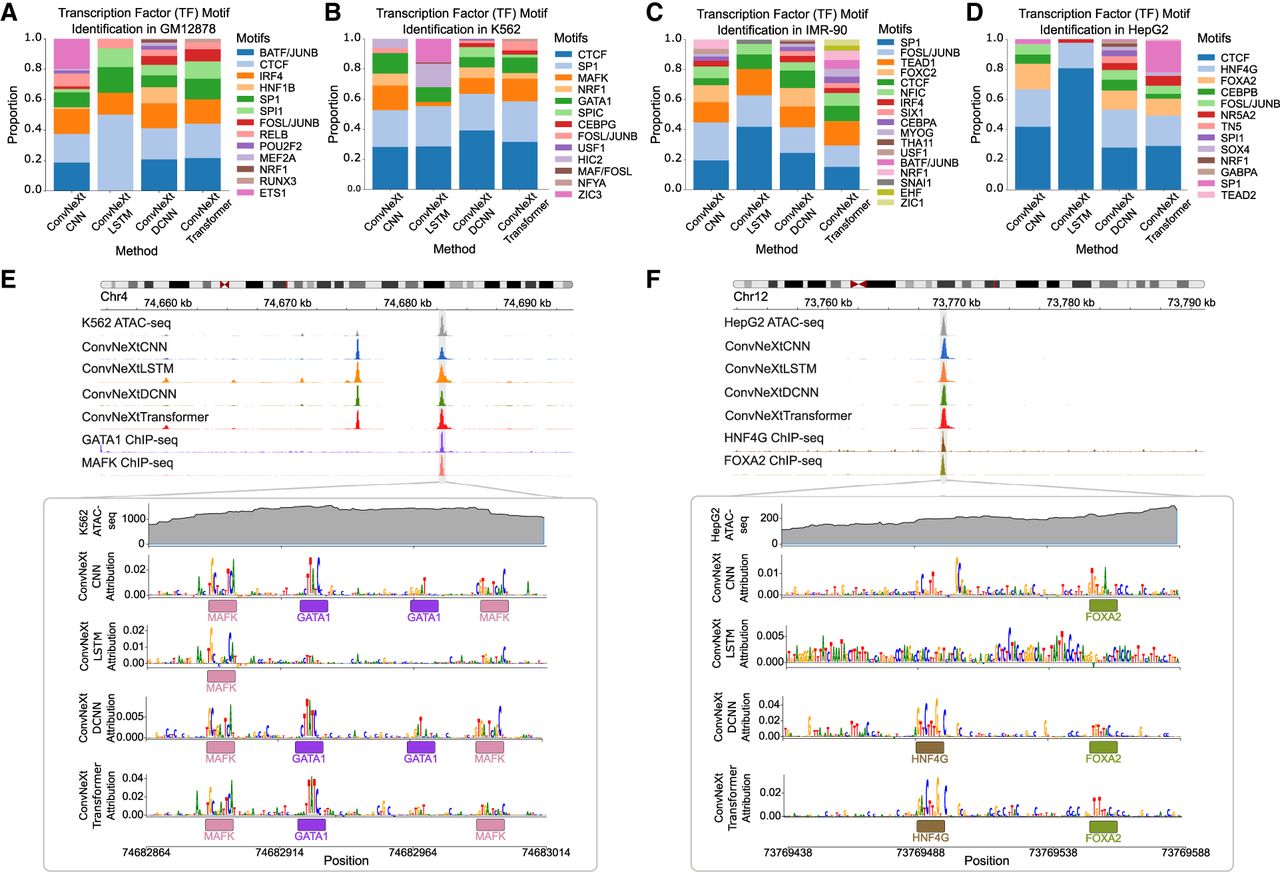
Figure 4.
Interpreting sequence features underlying model predictions. (A–D) Proportion of identified transcription factor motifs in different cell lines: (A) GM12878, (B) K562, (C) IMR-90, and (D) HepG2. (E) GATA1 and MAFK motifs identified by all ConvNeXt-based methods for an ATAC-seq peak region in the K562 cell line. (F) Similarly, HNF4G and FOXA2 motifs identified in an ATAC-seq peak region in the HepG2 cell line.


