
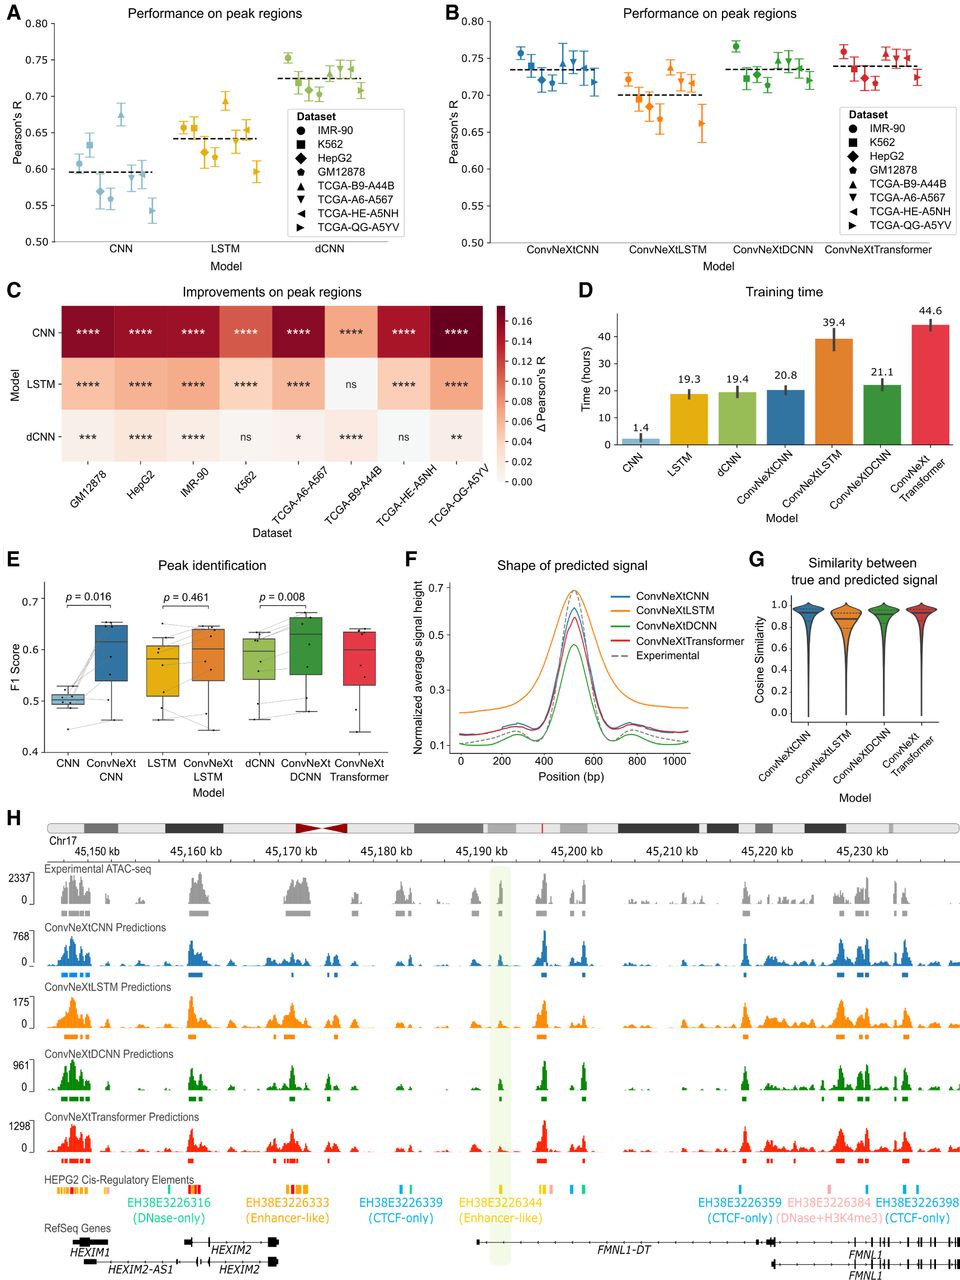
Model comparison across data sets. (A) Pearson’s correlation between true and predicted ATAC-seq signals in peak regions across eight distinct data sets for state-of-the-art models. (B) Performance comparison among the four models proposed in this work (ConvNeXtCNNs, ConvNeXtLSTMs, ConvNeXtDCNNs, and ConvNeXtTransformers) for the ATAC-seq peak regions stratified by cell lines and primary tumor samples. Each point depicts a test chromosome. The black dashed line shows the average performance of a model across all data sets and chromosomes. (C) Improvements of the new ConvNeXt-based methods proposed in this work for the ATAC-seq peaks as compared to existing methods. The significance is calculated with a two-sided Mann–Whitney U test on Pearson’s R calculated for each test chromosome. (****) P ≤ 0.0001, (***) P ≤ 0.001, (**) P ≤ 0.01, (*) P ≤ 0.05, ns: P > 0.05. The Δ Pearson’s R is calculated as the difference between mean Pearson’s R across all chromosomes for a ConvNeXt-based method and the corresponding existing method. (D) The total training time (in hours) of each method on a single RTX2080Ti GPU averaged across eight data sets. The error bar shows 95% confidence interval. Median training time is mentioned over each bar. (E) The F1 score is calculated for all the methods to evaluate the retrieval of ATAC-seq peak calls from the predictions. Each point represents one of the eight data sets. P-values are calculated using the Wilcoxon signed-rank test. (F) The average shape of the predicted ATAC-seq signal is compared against the experimental shape in the ATAC-seq peak regions of the GM12878 cell line. (G) Cosine similarity between experimental ATAC-seq and predicted ATAC-seq in the peak regions of the GM12878 cell line. (H) An example of predicted signal versus the experimental signal around the FMNL1 gene in the HepG2 cell line. A distal enhancer, discovered as a peak only based on the predictions of the ConvNeXtDCNN method, is highlighted.


