

Abstract
Currently, with the emergence of abundant single-cell multiomics data, there is a trend where labels are transferred from well-annotated scRNA-seq data to less-annotated omics data, such as scATAC-seq. This approach leverages the gene expression profiles available in scRNA-seq to help annotate common cell types and even novel cell types for other omics data. However, the heterogeneous features between scRNA-seq and scATAC-seq pose challenges for identifying different cell types, which hinders the discovery of novel types. In this study, we propose a new label transfer tool scSHEFT, which simultaneously considers gene expression count data, peak count data, and Gene Activity Scores as inputs to bridge the gap of heterogeneous features. Specifically, we transform scATAC-seq data into Gene Activity Scores based on prior knowledge to harmonize heterogeneous features. As the feature transformation would result in information loss, we introduce the raw ATAC-seq embeddings to preserve the original information. To achieve a balance between interomics alignment and intraomics heterogeneity, we propose a dual alignment strategy. Specifically, scSHEFT employs an anchor-based approach to align interomics anchor pairs and a contrastive-based strategy to preserve cellular heterogeneity within each omics layer. Benchmarking scSHEFT against 11 state-of-the-art methods across seven data sets demonstrates its superiority in handling data sets of varying scales and technical noises.
Recent advancements in single-cell high-throughput sequencing technologies have significantly improved our capacity to generate extensive single-cell data (Baysoy et al. 2023). Single-cell RNA sequencing (scRNA-seq) and single-cell ATAC sequencing (scATAC-seq) are two commonly used technologies to study cellular heterogeneity and regulatory mechanisms (Gayoso et al. 2021; Hao et al. 2021). However, the extreme high dimension and sparsity of scATAC-seq data pose challenges for precise cell-type annotation (Chen et al. 2019b). In contrast, scRNA-seq provides more informative gene expression profiles, benefitting more accurate cell-type identification (Ianevski et al. 2022; Zheng et al. 2025). Therefore, there is a trend that uses cell-type labels from scRNA-seq as reference to annotate scATAC-seq data (Brbić et al. 2020). In fact, its core target is to integrate scRNA-seq and scATAC-seq data into one consensus space. However, the integration faces significant challenges due to heterogeneous features and different batches of scATAC-seq and scRNA-seq data, making reliable alignment between two omics (referred as interomics alignment) difficult (Welch et al. 2017). Additionally, the inherent sparsity and noise of data exacerbate differences between two omics.
Current methods for labels transferring between scRNA-seq and scATAC-seq data can be divided into two types. Their major difference lies in the way to process the raw omics features. The first type of methods directly uses gene expression count data from scRNA-seq and peak count data from scATAC-seq as input to the model, and uses omics-specific neural networks to embed them (Ashuach et al. 2023). For example, GLUE is a representative method of this category, which integrates gene expression and peak count data and leverages prior regulatory knowledge to guide cross-omics alignment (Cao and Gao 2022). This approach preserves as much information as possible in the raw scATAC-seq features, which keeps the difference between omics. However, its interomics alignment is unreliable because of lacking reasonable and robust assumption for alignment, which can even lead to over-alignment. The second type of methods transforms scATAC-seq data into Gene Activity Scores (GAS) based on prior knowledge (Argelaguet et al. 2021). These methods generally use a shared neural network to extract features from GAS and gene expression count data such as scJoint (Lin et al. 2022b), scBridge (Li et al. 2023) and scNCL (Yan et al. 2023). By using the GAS, the second approach harmonizes the feature heterogeneity between scRNA-seq and scATAC-seq at first and facilitates the reliability of interomics alignment. In addition, this approach decreases computational complexity by reducing the dimensionality of scATAC-seq features from hundreds of thousands to tens of thousands (Danese et al. 2021; Stuart et al. 2021). However, the transformation process can lose the information in original scATAC-seq features, which may decrease the heterogeneity among cells.
Beyond these two main categories, recent methods such as MultiMAP have been developed to leverage all three types of features—gene expression, peak count data, and GAS—simultaneously (Jain et al. 2021). MultiMAP constructs a static weighted graph for each modality and uses GAS as a bridge for cross-modal alignment. Although this approach aims to leverage both raw and transformed features, it depends on static graphs constructed from reduced representations of the input data.
To address the limitations of current methods, we propose scSHEFT, a novel framework that simultaneously considers gene expression count data, peak count data, and GAS as inputs. Unlike MultiMAP, which relies on static graphs constructed from dimensionally reduced input features, scSHEFT leverages a deep learning framework to dynamically learn representations from all three data types. On one hand, scSHEFT employs peak-specific encoder to embed the peak count data, helping to preserve the information in original peak features. On the other hand, scSHEFT employs gene-specific encoder to embed gene expression and GAS data, which can guide the interomics alignment. scSHEFT calculates mutual nearest neighbors (MNNs) (Haghverdi et al. 2018) between omics based on GAS and gene expression count data. These MNNs are used as anchors in embedding alignment. Several objectives are proposed to achieve robust interomics embedding alignment and to preserve the variation in original omics features (referred as intraomics alignment). We compare scSHEFT with scNym (Kimmel and Kelley 2021), Portal (Zhao et al. 2022), Concerto (Yang et al. 2022), scGCN (Song et al. 2021), Seurat (Hao et al. 2021), scJoint (Lin et al. 2022b), scBridge (Li et al. 2023), scNCL (Yan et al. 2023), MultiMAP (Jain et al. 2021), GLUE (Cao and Gao 2022), and Scanorama (Hie et al. 2019) on seven data sets in terms of label transfer accuracy.
Results
Overview of scSHEFT
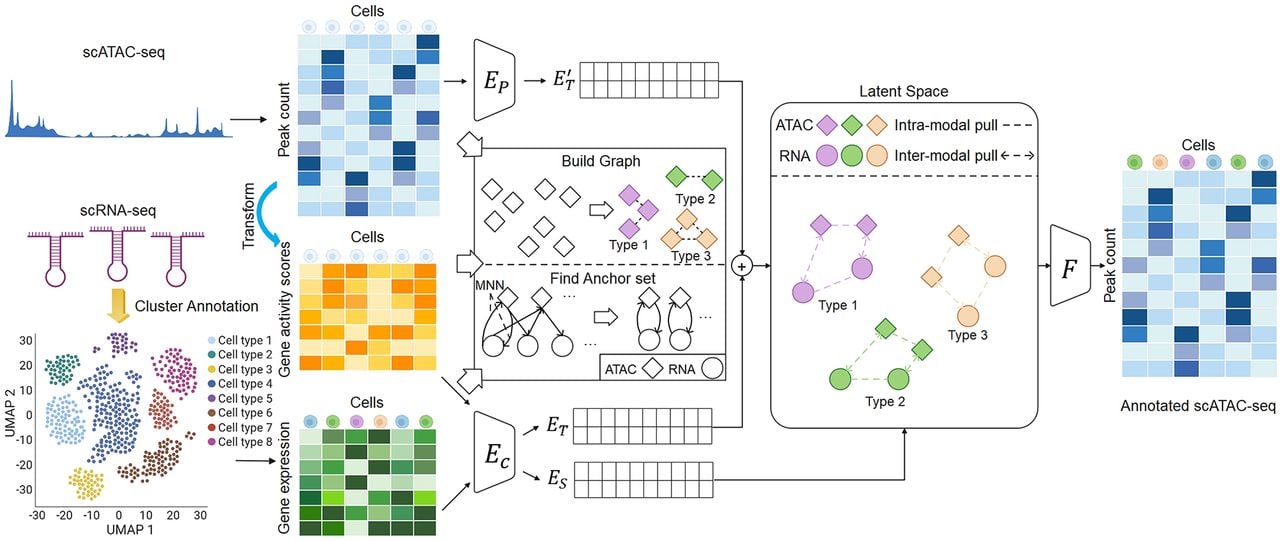
As shown in Figure 1, scSHEFT is a semi-supervised learning framework that aims to transfer labels from annotated scRNA-seq data to the unlabeled scATAC-seq data (referred as label transfer tasks). The inputs of scSHEFT consist of the gene expression count data from scRNA-seq, peak count data from raw scATAC-seq and its corresponding GAS data. scSHEFT employs a neural network for GAS and gene expression count data and another neural network for peak count data to embed these inputs into a low-dimensional latent space. The dual alignment strategy, including intraomics and interomics alignment, is proposed to optimize representation learning. Briefly, the intraomics alignment is used to learn discriminative embeddings of cells while the interomics alignment uses MNNs as anchors to align embeddings between scRNA-seq and scATAC-seq. Finally, a classifier network is trained to infer cell types.
Overview of scSHEFT. The input to scSHEFT consists of gene expression count data, peak count data, and GAS. scSHEFT employs a peak-specific encoder to embed the peak count data and a shared gene-specific encoder for embedding the gene expression and GAS data. Two alignment strategies, intraomics and interomics, are introduced to optimize the cellular embeddings in the latent space, ensuring that similar cells are clustered both within and across different omics layers.
Data sets
We collected seven data sets for evaluation, including five paired and two unpaired multiomics data sets (see Supplemental Notes). Paired multiomics data sets consist of samples where corresponding measurements from different omics are obtained from the same individual cells. In contrast, unpaired multiomics data sets involve samples where the measurements are derived from different cells without a one-to-one correspondence (Huizing et al. 2023; Miao et al. 2021). Among the paired data sets, the SNARE-seq data set (Chen et al. 2019a) contains 1017 cells derived from a mixture of human cell lines with four different cell types. The T cell bone marrow data set (Persad et al. 2023) contains 7439 T cell depleted cells from human bone marrow, which has 11 different cell types. The CD34 bone marrow data set (Persad et al. 2023) contains 6881 CD34+ hematopoietic stem and progenitor cells from eight different types, derived from human bone marrow. The SHARE-seq data set (Ma et al. 2020) contains 32,231 cells from mouse skin, having 22 different cell types. The 10x Multiome data set contains 11,363 cells isolated from human intra-abdominal lymph node tissue, including seven different cell types.
For the unpaired data sets, the CITE-ASAP data set (Mimitou et al. 2021) derives from a T cell stimulation experiment, integrating data from CITE-seq and ASAP-seq, which profiles gene expression level or chromatin accessibility simultaneously with surface protein levels. The PBMC data set uses the same sequencing technologies as the CITE-ASAP data set, consisting of 111,351 RNA cells and 77,810 ATAC cells from seven different cell types.
Evaluation
In label transfer tasks, we used accuracy and F1-score metrics to evaluate model performance across different data sets. For the shared cell-type T between scRNA-seq and scATAC-seq, the label transfer accuracy is as follows:
In addition, we also used the F1-score to further evaluate label transfer performance for various methods. The calculation formula for the F1-score is as follows:
These metrics provide an overall evaluation for the accuracy and robustness of the model in label transfer tasks by comparing the annotations to the predictions.
scSHEFT accurately identifies cell types in the benchmarks
To validate the high performance of scSHEFT in label transfer tasks, we conducted a comprehensive comparison using six single-cell multiomics data sets: SNARE-seq, T cell bone marrow, CD34 bone marrow, CITE-ASAP, SHARE-seq, and 10x Multiome. scSHEFT was benchmarked against eleven other state-of-the-art data integration methods: scNym, Portal, Concerto, scGCN, Seurat, scJoint, scBridge, scNCL, MultiMAP, GLUE, and Scanorama. The evaluation results were summarized in Figure 2.
Benchmarking results across six data sets. (A) The label transfer accuracy and F1-score of scNym, Portal, Concerto, scGCN, Seurat, scJoint, scBridge, scNCL, and scSHEFT on six data sets. (B) UMAP visualizations of the scATAC-seq cell embeddings generated by different methods on the T cell bone marrow data set, with cells colored by type. (C) Label transfer matrix comparing predicted labels with ground-truth annotations, where a clearer diagonal indicates better label transfer performance.

On the SNARE-seq small data set, scSHEFT achieves an impressive accuracy of 95.97% and an F1-score of 95.18%, significantly outperforming competing methods, which exhibit accuracies ranging from 51.52% to 86.82% and F1-scores from 32.99% to 82.49%. In the T cell bone marrow data set, the accuracy of all methods exceeds 60%, which may be attributed to the data set’s relatively simple cell-type composition and distinct cell types. scSHEFT achieves the highest label transfer accuracy and F1-scores, 90.66% and 73.85%. Although Portal’s accuracy is comparable to that of scSHEFT, scSHEFT’s F1-scores significantly surpass Portal’s. The CD34 bone marrow data set reveals lower performance for scNym and Concerto, whereas scSHEFT achieves strong results with an accuracy of 83.05% and an F1-score of 80.48%. Conversely, on the unpaired CITE-ASAP data set, scBridge shows a marked decline in performance, likely due to data noise affecting reliable cell selection, whereas scGCN, Seurat, scNCL, and scSHEFT maintain accuracy and F1-scores above 0.80, highlighting their scalability on unpaired data. The SHARE-seq data set, characterized by tissue heterogeneity, presents significant challenges, with top accuracies barely surpassing 60%. However, scSHEFT emerges with the highest accuracy (65.12%) and F1-score (62.34%), maintaining a small margin between metrics. Finally, on the 10x Multiome data set, scSHEFT, alongside Portal and scBridge, achieves high accuracy and F1-scores, reinforcing its efficacy across diverse scenarios. These results collectively underscore scSHEFT’s advantages in label transfer across small and large-scale data sets (Fig. 2A).
An inspection of UMAP plots (Fig. 2B) reveals that scSHEFT preserves clearer clusters at both the micro level (ETP, Mono2, and Ery) and the macro level of the data set compared with scJoint and scGCN. To validate this, we used the Davies–Bouldin Index (DBI) on the embeddings generated by scSHEFT, scJoint, and scGCN. scSHEFT achieves the lowest DBI values across both individual cell types and the whole data set, indicating better clustering performance (Supplemental Fig. S1). Additionally, UMAP visualization reveals that scSHEFT generates a more continuous and well-defined erythroid trajectory—from MEP to EryPre to Ery—compared with scJoint and scGCN. To quantitatively support this observation, we inferred pseudotime from the original cell embeddings using diffusion pseudotime analysis (Haghverdi et al. 2016) and examined the Spearman’s correlation between FECH expression (Chen et al. 2010; Chung et al. 2017) and pseudotime as an indicator of trajectory continuity. The results show that scSHEFT achieves the highest correlation, followed by scGCN and scJoint (Supplemental Fig. S2), demonstrating that scSHEFT better preserves the continuous molecular progression along the erythroid lineage.
To further evaluate the cell-type identification abilities of different methods in the label transfer task, we illustrated the label transfer matrix (Fig. 2C; Supplemental Fig. S3) for comparison. As shown, scSHEFT (92.34% Accuracy, 84.13% F1-score) shows a clearer diagonal label transfer matrix compared to scJoint (83.21% Accuracy, 50.47% F1-score) and scGCN (82.78% Accuracy, 64.29% F1-score). Additionally, we find that the ETP cell type, which constitutes the smallest proportion of the data set, is predicted correctly by scSHEFT, whereas scJoint and scGCN frequently misclassify them as EryPre cells, the second largest cell type. This highlights scSHEFT’s capability to handle imbalanced cell types.
In summary, these results indicate that scSHEFT is accurate and robust to handling label transfer tasks.
scSHEFT enables scalable and efficient analysis of single-cell multiomics data sets
As sequencing technologies rapidly advance, there is a growing demand for efficient processing and accurate analysis of large-scale single-cell multiomics data (Lin et al. 2022a; De Donno et al. 2023). In this study, we used the large-scale data set to evaluate the scalability and robustness of all methods. We subsampled both scRNA-seq and scATAC-seq on the PBMC data set and repeated evaluation five times with different cell numbers. As the data set size increases, scSHEFT consistently shows superior robustness and higher accuracy and F1-scores compared with other methods (Fig. 3). Notably, the label transfer accuracy of scSHEFT remains around 90%, and the F1- scores stay around 80% with various data set sizes. Although Seurat and Portal also achieve high label transfer performance, Seurat’s performance is unstable with varying cell numbers, and Portal’s label transfer accuracy is lower than that of scSHEFT. These results demonstrate scSHEFT has superior scalability and is accurate and robust in handling various data set sizes.
Evaluation results on the large-scale data set. The label transfer accuracy and F1-score of these methods on the PBMC data set. Five independent experiments are conducted with different downsampled cell sets. The boxplots represent the distribution of results, with the boxes spanning from the upper to lower quartiles, the horizontal line indicating the median, and whiskers extending up to 1.5 times the interquartile range.

To further assess computational efficiency, we benchmarked the runtime and memory usage of scSHEFT and all baseline methods using PBMC subsamples of n ∈ {20,000; 40,000; 60,000; 80,000; 100,000} cells. For each subset, we measured both the (logged) running time and peak memory usage (Supplemental Fig. S4). All methods were run on a workstation equipped with an Intel Core i9-10980XE CPU and an NVIDIA GeForce RTX 3090 GPU (24 GB). scSHEFT maintains stable running time as the number of cells increases, primarily due to its fixed training batch size and a constant number of training steps. The memory usage of scSHEFT gradually increases with the number of cells, and together with MultiMAP, these two methods exhibit the highest memory consumption among all methods. This is expected, as both utilize gene expression counts, peak counts, and GAS as input, whereas other methods use only GAS or peak counts alongside gene expression data, resulting in lower memory usage.
scSHEFT is robust against technical dropout noise in sequencing data
Technical noises in single-cell sequencing arise from various biological and technical factors, leading to the presence of false-zeros, which hinders the effectiveness of data analysis (Huang et al. 2018). Similar to scBridge (Li et al. 2023), we simulated those dropout noises on T cell bone marrow data set by using the downsampleMatrix function from the scuttle R package to evaluate the robustness of all methods. The results vary with RNA and ATAC dropout rates (Fig. 4A). As shown, scSHEFT achieves superior robustness and outperforms other methods towards the scRNA-seq and scATAC-seq data quality. Namely, scSHEFT maintains high level label transfer accuracy of over 90%, and its F1-scores are higher than those of other methods. In contrast, other methods such as scGCN and Seurat achieve good performance under specific dropout rates. Their accuracy, F1-scores and robustness drop with increasing dropout rates. Notably, scNym shows significant variability in its results across repeated experiments, indicating insufficient robustness on this data set. By comparison, both Portal and scJoint show robust performance with respect to scRNA-seq and scATAC-seq data quality. However, their accuracy is inferior to that of scSHEFT, particularly as scJoint’s F1-score is substantially lower, which will be discussed in the following section.
Evaluation results under simulated sequencing noise. (A) The label transfer accuracy and F1-score of scSHEFT and nine comparative methods across different dropout corruption rates on scRNA-seq and scATAC-seq data. Five independent experiments are performed for each dropout rate. Boxplots show the upper and lower quartiles, with the median as the horizontal line and whiskers extending to 1.5 times the interquartile range. (B) Label transfer matrix comparing predicted labels with ground-truth annotations, where a clearer diagonal indicates better label transfer performance.
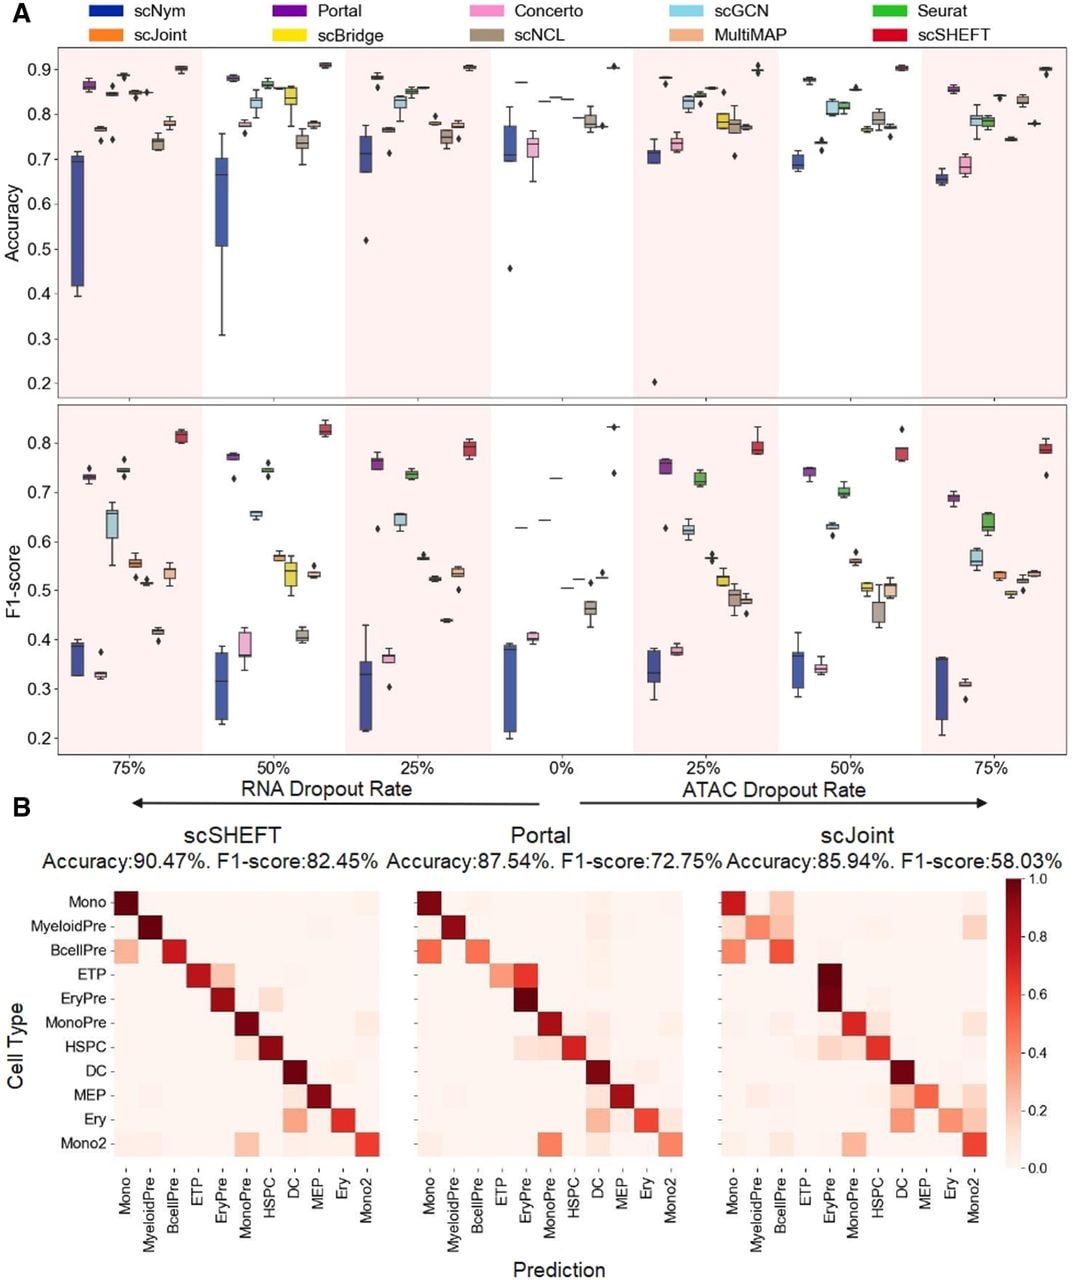
To further evaluate the cell-type identification abilities of different methods against technical noises, we illustrated the label transfer matrix under 50% dropout on scRNA-seq data (Fig. 4B; Supplemental Fig. S5) for comparison. As shown, scSHEFT achieves an accuracy rate of 90.47%, higher than Portal’s 87.54% and scJoint’s 85.94%. The high accuracy rates (above 80%) achieved by all three models can be attributed, in part, to their successful prediction of the Mono cell type, which constitutes the first largest proportion of the data set. In addition, scSHEFT achieves a F1-score of 82.45%, higher than Portal’s 72.75% and scJoint’s 58.03%. The lower F1-scores of Portal and scJoint can be attributed to their insufficient robustness in handling imbalanced cell-type predictions. For example, BcellPre cell type, which is the third smallest proportion of the data set, is mainly predicted correctly by scSHEFT, whereas Portal and scJoint frequently misclassify them as Mono cells. Moreover, ETP cell type, which is the smallest proportion of the data set, is mainly predicted correctly by scSHEFT, whereas Portal and scJoint frequently misclassify them as EryPre cells, the second largest cell type. Similarly, scSHEFT achieves superior performance on other corrupted scRNA-seq and scATAC-seq data sets, even under high dropout rates. Such robustness of scSHEFT can be attributed to its reliable intraomics and interomics alignment, which further help the model to identify different cells even under imbalanced cell-type conditions.
In summary, these results demonstrate that scSHEFT effectively identifies cells despite dropout noises and show its ability to handle sequencing data with low capture rate.
scSHEFT effectively discovers novel cell types
In many label transfer tasks, the cell type is not always consistent across scRNA-seq and scATAC-seq data (Zhang et al. 2022). Therefore, it is highly expected that methods not only accurately identify common cell types but also distinguish novel types present in the target data. For this purpose, we conducted a challenging evaluation on the CITE-ASAP data set, where dendritic cells (DCs) are unique to the scATAC-seq data. To further increase the difficulty, we manually removed monocytes from the scRNA-seq data. In other words, there are only six cell types shared between the scRNA-seq and scATAC-seq data, whereas the scATAC-seq data contains two additional unique cell types. The UMAP visualizations respectively show the cell types and common mask for scATAC-seq data (Fig. 5A,B).
Evaluation of novel cell-type discovery. (A) UMAP visualization of scATAC-seq cell embeddings generated by scSHEFT on the CITE-ASAP data set, with cells colored according to their cell type. (B) UMAP visualization of scATAC-seq cell embeddings generated by scSHEFT on the CITE-ASAP data set, with cells colored according to the common cell-type mask. (C) UMAP visualization of scATAC-seq cell embeddings generated by scSHEFT on the CITE-ASAP data set, with cells colored by prediction confidence score. (D) Kernel density estimation (KDE) plot showing the distribution of prediction probabilities for scATAC-seq cells, based on scSHEFT’s outputs.
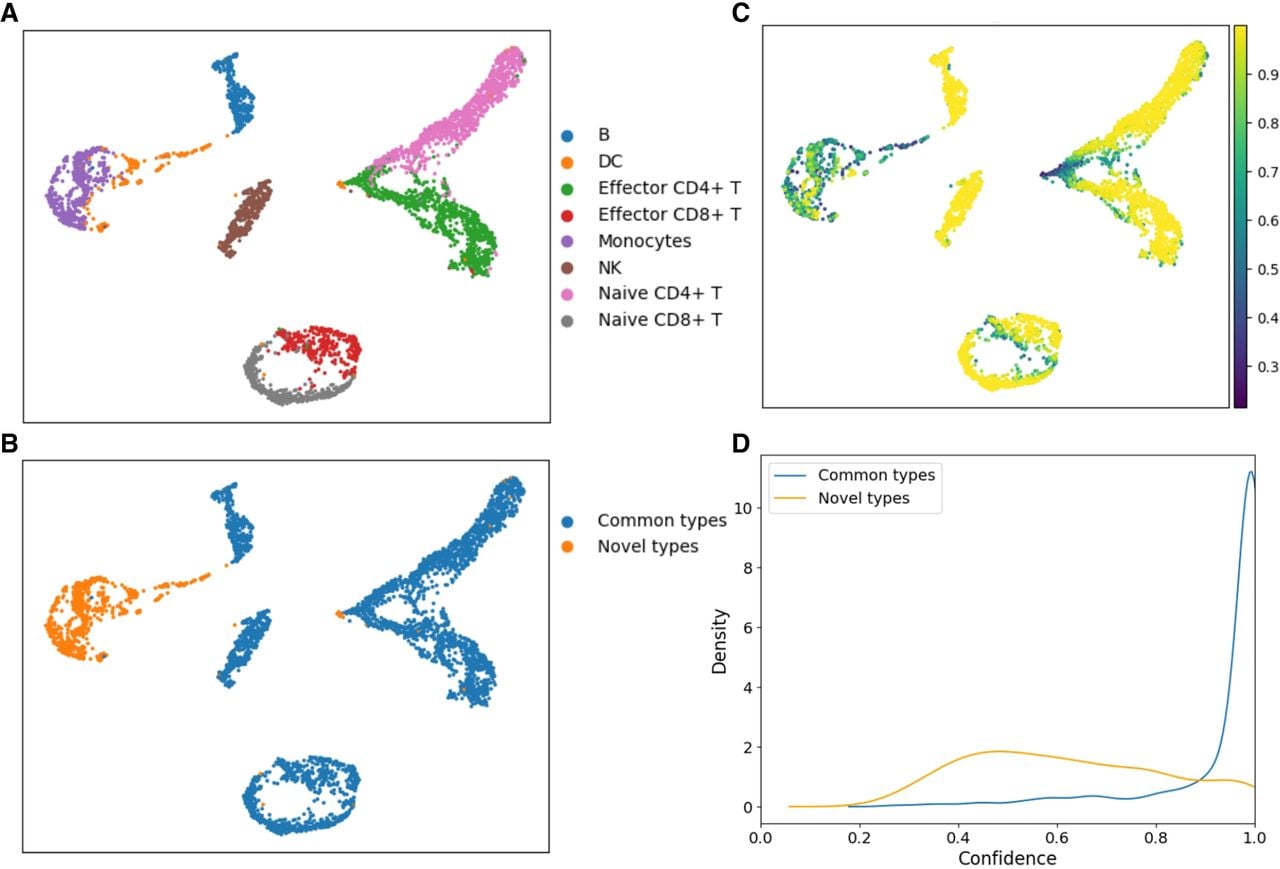
Next, we examined the results for DCs and monocytes in the scATAC-seq data, which represent novel cell types relative to the annotations in the scRNA-seq data. For these novel cell types, scSHEFT assigns a relatively low confidence score, while yielding higher confidence for the common cell types (Fig. 5C). To provide a more intuitive assessment of scSHEFT’s ability to distinguish novel cell types, we visualized the prediction probability distribution for scATAC-seq cells using kernel density estimation (Fig. 5D). Notably, the prediction probabilities for common cell types are predominantly concentrated near 1, whereas those for novel cell types are centered around 0.45. This distinct distribution pattern further demonstrates that scSHEFT effectively discriminates between novel and common cell types.
Parameter sensitivity experiment
To assess the robustness of scSHEFT under different hyperparameter settings, we conducted a systematic sensitivity analysis using four data sets, each containing more than 5000 cells (Supplemental Fig. S6). We focused on the main loss weights: anchor inter alignment (α1, anchor loss), center inter alignment (α2, center loss), classification-guided intra alignment (β1, cross-entropy loss), and contrast intra alignment (β2, InfoNCE loss). The default values are α1 = 0.5, α2 = 5, β1 = 1, and β2 = 0.1. The temperature coefficient for InfoNCE loss is τ = 0.1 (see Methods). For each experiment, we varied one hyperparameter while keeping the others fixed at their default values. Each setting was repeated five times with different random seeds and results were reported as mean ± s.d. scSHEFT maintains stable label transfer accuracy and F1-score across a wide range of hyperparameter values. The default values are suitable for general use.
Comparison with MNN-based baseline and robustness to MNN reliability
To evaluate the impact of mutual nearest neighbor (MNN) reliability on label transfer performance, we compared scSHEFT with Scanorama (Hie et al. 2019), a representative MNN-based method, using four benchmark data sets where Scanorama achieved its best results (Supplemental Fig. S7). The results indicate that scSHEFT consistently achieves higher accuracy and F1-score than Scanorama, demonstrating the added benefit provided by scSHEFT’s enhancements over the baseline MNN approach.
We further assessed the robustness of scSHEFT under conditions of technical noise and unreliable MNNs by introducing varying levels of simulated noise into the original MNN pairs (MNN noise ratio) across these data sets (Supplemental Fig. S8). Each experiment was repeated five times with different random seeds to ensure reliability. The results show that scSHEFT maintains stable accuracy and F1-score even as the MNN noise ratio increases, confirming its robustness to technical noise and unreliable MNNs. These findings indicate that scSHEFT performs reliably across data sets generated with different sequencing technologies.
Ablation study
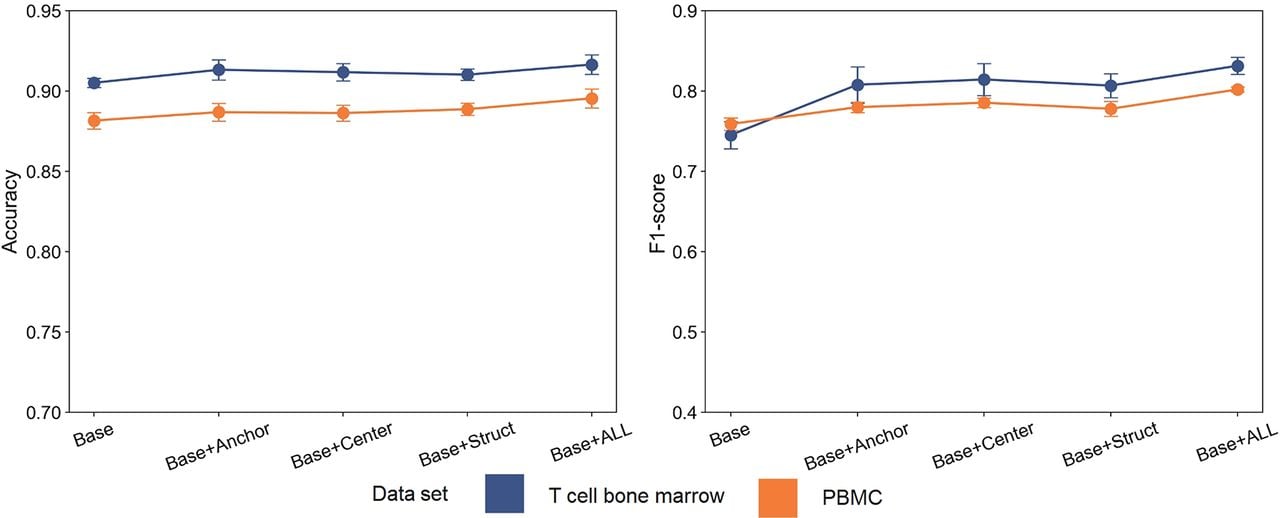
To evaluate the contribution of each model component, we performed systematic ablation experiments on both a paired T cell bone marrow data set and an unpaired PBMC data set (Fig. 6). At the macro level, we assessed overall label transfer performance by incrementally introducing individual components—Anchor loss, Center loss, and a fusion embedding strategy that integrates peak and gene activity features through a weighted sum—into a base model comprising intraomics alignment with CrossEntropy and InfoNCE losses (Supplemental Table S1). For each configuration, we repeated experiments five times with different random seeds. This approach enabled quantification of the individual and combined effects of each component on overall accuracy and F1-score.
Ablation study results on T cell bone marrow (paired) and PBMC (unpaired) data sets (n = 5 repeats with different model random seeds). Error bars indicate mean ± s.d.
At the micro level, we examined the impact of each component on individual cell types through cell-type-specific ablation analyses across both data sets. For each cell type, we compared accuracy and F1-score with and without the inclusion of all components (Supplemental Figs. S9, S10). The results show that most cell types, including rare populations, benefit substantially from the full model. Notably, in ETP cells on the T cell bone marrow data set, the full model shows an 85% improvement in accuracy and a 67.53% improvement in F1-score compared to the base model. This enhancement indicates that integrating all components enables precise capture of cell-type-specific signatures, ensuring consistent and robust performance across diverse populations.
Together, these macro-level and micro-level ablation studies demonstrate that each proposed strategy contributes to both overall and cell-type-specific label transfer performance, validating the effectiveness and robustness of scSHEFT across different data sets. All components contribute to the overall improvement, and the fusion of raw scATAC-seq data provides additional benefits, highlighting its potential for broader applications in single-cell multiomics data integration.
Discussion
In this paper, scSHEFT is a label transfer method based on dual alignment from well-annotated scRNA-seq data to scATAC-seq data. scSHEFT takes gene expression counts, peak counts, and GAS as complementary inputs to perform label transfer. It uses GAS to bridge the feature heterogeneity between these two data types. However, the direct alignment between GAS and gene expression counts may reduce alignment accuracy as it may lose information in the original scATAC-seq features. To address this issue, we introduce a peak-specific encoder that embeds the raw scATAC-seq peak count data. Building on these, scSHEFT employs a dual alignment strategy using intraomics and interomics loss functions to achieve robust and effective alignment within and across omics. Through comprehensive benchmarking across diverse data sets and sequencing conditions, scSHEFT demonstrates superior accuracy, robustness, and scalability compared with 11 state-of-the-art methods. Its cell embeddings also capture continuous differentiation trajectories consistent with underlying biological processes. In addition, scSHEFT successfully annotates both common and novel cell types, showcasing its capacity to discover new cell types.
Although scSHEFT achieves high accuracy and stable performance, its current design increases memory requirements with larger data sets. To address this issue, future improvements could employ divide-and-conquer or distributed training strategies to reduce computational cost while maintaining robust performance. Although scSHEFT focuses on label transfer between scRNA-seq and scATAC-seq data in this study, it could be extended to broader multiomics integration (Hao et al. 2024; Lee and Li 2024). Future work may incorporate additional data types such as proteomic and methylation data, enabling scSHEFT to leverage diverse molecular modalities for improved annotation and regulatory insight. Furthermore, scSHEFT could be adapted for spatiotemporal single-cell integration, where temporal label transfer across modalities would facilitate modeling of dynamic cell-state transitions and regulatory trajectories.
Methods
Preprocessing
For the given labeled scRNA-seq data, denotes gene expression count data from scRNA-seq and denotes its labels. On the other hand, for the unlabeled scATAC-seq data, denotes peak count data. We use EpiScanpy (Danese et al. 2021) tool to transform the peak count data into GAS based on prior biological knowledge to bridge the gap between these two omics, where Ns and Nt denote the number of cells in the scRNA-seq and scATAC-seq data set, G and P denote the total number of genes and peaks.
For gene expression count data Xs and GAS Xt, a gene encoder network f1 (X) is used to transform them into cell embeddings. For peak count data Pt, a peak encoder network f2 (X) is used to embed them into low dimension. The scATAC-seq cell embedding is obtained by a weighted sum of and . After that, the shared classification head g takes embeddings from encoders as input and outputs k-class probability vector after softmax transformation, prob=Softmax(g(f1 (X))) or g(f(X, P)). For each cell i, we take the class with the highest prediction probability as the predicted cell type, denoted as . At the same time, the labeled scRNA-seq data are used to guide the training of the model.
Anchor-based interomics alignment
Integrating scRNA-seq and scATAC-seq data poses significant challenges due to their inherent heterogeneity, which results in distinct distributions within their feature spaces. This feature-level disparity highlights the need for sophisticated alignment methods to bridge these gaps effectively. Current methods address interomics alignment in different ways. For example, scJoint (Lin et al. 2022b) and scNCL (Yan et al. 2023) select intermodal cell pairs with high embedding similarity within each training batch as alignment objective. However, this approach can introduce incorrect alignment objectives and aggravate misalignment, particularly as the embedding spaces are unstable in the early training stages.
To overcome these challenges, we introduce Anchor Loss, which aligns interomics data by leveraging reliable cell anchors to enhance the consistency of relationships between omics layers. To further refine this alignment, we apply the Mutual Nearest Neighbors (MNN) to gene expression count and GAS. Specifically, we calculate the k-nearest neighbors for cells between two omics data sets. If cells from both data sets are mutual neighbors, we identify them as anchor pairs. In this way, we build the global anchor set , where i and j denote the selected cell pair index from gene expression count and GAS, and |M| denotes the size of global anchor set. We sample |MB| anchors from M for each batch. This approach selects cell pairs before training and therefore ensures stability of interomics alignment. During training, the anchor pairs are aligned per batch according to the following formula:
Although many interomics alignment strategies effectively make features across data sets more comparable, they can sometimes result in the misalignment of distinct cell types. This misalignment would lead to a significant loss of cellular heterogeneity. To overcome this limitation and ensure accurate cell-type alignment, we employ a Center loss approach inspired by scBridge (Li et al. 2023). Specifically, we minimize the distance between the embedding centers of each cell type across different omics data. The embedding center for each cell type is computed as follows:
We update the final cell-type center, and , using a momentum ε:
We minimize the mean squared error (MSE) between these centers:
The total interomics alignment loss function Linter is given by
Contrastive-based intraomics alignment
Although effective interomics alignment connects distinct omics layers, it often neglects the inherent cellular heterogeneity within each omics data set. To address these limitations, we employ a combination of CrossEntropy Loss and InfoNCE Loss to enhance cell classification accuracy within each omics. This design can maintain the model’s ability to distinguish between different cell types while preserving the biological similarity among cells. Specifically, CrossEntropy Loss is applied to learn discriminative embeddings for distinct cell types, which is defined as follows:
Another important task of cell representation is to maintain the biological similarity among cells. To maintain this similarity in scATAC-seq data, scSHEFT employs infoNCE Loss (Tarazona et al. 2021) to preserve the similarity. Specifically, we build a KNN graph using peak count data to identify neighbor sets for each cell. For each cell in a mini-batch, neighbor cells are selected from their corresponding neighbor sets and positive pairs are constructed. These positive pairs are aligned as follows:
The total loss function Lintra for intraomics alignment is defined as
Code availability
The source code and data used in this paper are available at GitHub (https://github.com/CSUBioGroup/scSHEFT) and as Supplemental Code.
Competing interest statement
The authors declare no competing interests.
Acknowledgments
This work was supported by the National Natural Science Foundation of China (No. 62225209) and the Key Program of the Hunan Provincial Natural Science Foundation (No. 2025JJ30025). This work was also supported in part by the High Performance Computing Center of Central South University.
Author contributions: Z.H. and M.L. conceived the study and wrote the paper. Z.H., R.Z., and X.Y. performed the experiments. P.J. collected the data. Z.H., R.Z., and J.C. analyzed and interpreted the results. All authors discussed the findings and approved the final manuscript.
Footnotes
[1] Supplementary material [Supplemental material is available for this article.]
[2] Article published online before print. Article, supplemental material, and publication date are at https://www.genome.org/cgi/doi/10.1101/gr.280410.125.
References
- ↵Argelaguet R, Cuomo AS, Stegle O, Marioni JC. 2021. Computational principles and challenges in single-cell data integration. Nat Biotechnol 39: 1202–1215. 10.1038/s41587-021-00895-7
- ↵Ashuach T, Gabitto MI, Koodli RV, Saldi G-A, Jordan MI, Yosef N. 2023. Multivi: deep generative model for the integration of multimodal data. Nat Methods 20: 1222–1231. 10.1038/s41592-023-01909-9
- ↵Baysoy A, Bai Z, Satija R, Fan R. 2023. The technological landscape and applications of single-cell multi-omics. Nat Rev Mol Cell Biol 24: 695–713. 10.1038/s41580-023-00615-w
- ↵Brbić M, Zitnik M, Wang S, Pisco AO, Altman RB, Darmanis S, Leskovec J. 2020. Mars: discovering novel cell types across heterogeneous single-cell experiments. Nat Methods 17: 1200–1206. 10.1038/s41592-020-00979-3
- ↵Cao Z-J, Gao G. 2022. Multi-omics single-cell data integration and regulatory inference with graph-linked embedding. Nat Biotechnol 40: 1458–1466. 10.1038/s41587-022-01284-4
- ↵Chen W, Dailey HA, Paw BH. 2010. Ferrochelatase forms an oligomeric complex with mitoferrin-1 and Abcb10 for erythroid heme biosynthesis. Blood 116: 628–630. 10.1182/blood-2009-12-259614
- ↵Chen S, Lake BB, Zhang K. 2019a. High-throughput sequencing of the transcriptome and chromatin accessibility in the same cell. Nat Biotechnol 37: 1452–1457. 10.1038/s41587-019-0290-0
- ↵Chen H, Lareau C, Andreani T, Vinyard ME, Garcia SP, Clement K, Andrade-Navarro MA, Buenrostro JD, Pinello L. 2019b. Assessment of computational methods for the analysis of single-cell ATAC-seq data. Genome Biol 20: 241. 10.1186/s13059-019-1854-5
- ↵Chung J, Wittig JG, Ghamari A, Maeda M, Dailey TA, Bergonia H, Kafina MD, Coughlin EE, Minogue CE, Hebert AS, et al. 2017. Erythropoietin signaling regulates heme biosynthesis. elife 6: e24767. 10.7554/eLife.24767
- ↵Danese A, Richter ML, Chaichoompu K, Fischer DS, Theis FJ, Colomé-Tatché M. 2021. Episcanpy: integrated single-cell epigenomic analysis. Nat Commun 12: 5228. 10.1038/s41467-021-25131-3
- ↵De Donno C, Hediyeh-Zadeh S, Moinfar AA, Wagenstetter M, Zappia L, Lotfollahi M, Theis FJ. 2023. Population-level integration of single-cell datasets enables multi-scale analysis across samples. Nat Methods 20: 1683–1692. 10.1038/s41592-023-02035-2
- ↵Gayoso A, Steier Z, Lopez R, Regier J, Nazor KL, Streets A, Yosef N. 2021. Joint probabilistic modeling of single-cell multi-omic data with totalVI. Nat Methods 18: 272–282. 10.1038/s41592-020-01050-x
- ↵Haghverdi L, Büttner M, Wolf FA, Buettner F, Theis FJ. 2016. Diffusion pseudotime robustly reconstructs lineage branching. Nat Methods 13: 845–848. 10.1038/nmeth.3971
- ↵Haghverdi L, Lun ATL, Morgan MD, Marioni JC. 2018. Batch effects in single-cell RNA-sequencing data are corrected by matching mutual nearest neighbors. Nat Biotechnol 36: 421–427. 10.1038/nbt.4091
- ↵Hao Y, Hao S, Andersen-Nissen E, Mauck WM, Zheng S, Butler A, Lee MJ, Wilk AJ, Darby C, Zager M, et al. 2021. Integrated analysis of multimodal single-cell data. Cell 184: 3573–3587.e29. 10.1016/j.cell.2021.04.048
- ↵Hao Y, Stuart T, Kowalski MH, Choudhary S, Hoffman P, Hartman A, Srivastava A, Molla G, Madad S, Fernandez-Granda C, et al. 2024. Dictionary learning for integrative, multimodal and scalable single-cell analysis. Nat Biotechnol 42: 293–304. 10.1038/s41587-023-01767-y
- ↵Hie B, Bryson B, Berger B. 2019. Efficient integration of heterogeneous single-cell transcriptomes using scanorama. Nat Biotechnol 37: 685–691. 10.1038/s41587-019-0113-3
- ↵Huang M, Wang J, Torre E, Dueck H, Shaffer S, Bonasio R, Murray JI, Raj A, Li M, Zhang NR. 2018. Saver: gene expression recovery for single-cell RNA sequencing. Nat Methods 15: 539–542. 10.1038/s41592-018-0033-z
- ↵Huizing G-J, Deutschmann IM, Peyré G, Cantini L. 2023. Paired single-cell multi-omics data integration with Mowgli. Nat Commun 14: 7711. 10.1038/s41467-023-43019-2
- ↵Ianevski A, Giri AK, Aittokallio T. 2022. Fully-automated and ultra-fast cell-type identification using specific marker combinations from single-cell transcriptomic data. Nat Commun 13: 1246. 10.1038/s41467-022-28803-w
- ↵Jain MS, Polanski K, Conde CD, Chen X, Park J, Mamanova L, Knights A, Botting RA, Stephenson E, Haniffa M, et al. 2021. MultiMAP: dimensionality reduction and integration of multimodal data. Genome Biol 22: 346. 10.1186/s13059-021-02565-y
- ↵Kimmel JC, Kelley DR. 2021. Semisupervised adversarial neural networks for single-cell classification. Genome Res 31: 1781–1793. 10.1101/gr.268581.120
- ↵Lee MY, Li M. 2024. Integration of multi-modal single-cell data. Nat Biotechnol 42: 190–191. 10.1038/s41587-023-01826-4
- ↵Li Y, Zhang D, Yang M, Peng D, Yu J, Liu Y, Lv J, Chen L, Peng X. 2023. scBridge embraces cell heterogeneity in single-cell RNA-seq and ATAC-seq data integration. Nat Commun 14: 6045. 10.1038/s41467-023-41795-5
- ↵Lin X, Tian T, Wei Z, Hakonarson H. 2022a. Clustering of single-cell multi-omics data with a multimodal deep learning method. Nat Commun 13: 7705. 10.1038/s41467-022-35031-9
- ↵Lin Y, Wu T-Y, Wan S, Yang JY, Wong WH, Wang YR. 2022b. scJoint integrates atlas-scale single-cell RNA-seq and aTAC-seq data with transfer learning. Nat Biotechnol 40: 703–710. 10.1038/s41587-021-01161-6
- ↵Ma S, Zhang B, LaFave LM, Earl AS, Chiang Z, Hu Y, Ding J, Brack A, Kartha VK, Tay T, et al. 2020. Chromatin potential identified by shared single-cell profiling of RNA and chromatin. Cell 183: 1103–1116.e20. 10.1016/j.cell.2020.09.056
- ↵Miao Z, Humphreys BD, McMahon AP, Kim J. 2021. Multi-omics integration in the age of million single-cell data. Nat Rev Nephrol 17: 710–724. 10.1038/s41581-021-00463-x
- ↵Mimitou EP, Lareau CA, Chen KY, Zorzetto-Fernandes AL, Hao Y, Takeshima Y, Luo W, Huang T-S, Yeung BZ, Papalexi E, et al. 2021. Scalable, multimodal profiling of chromatin accessibility, gene expression and protein levels in single cells. Nat Biotechnol 39: 1246–1258. 10.1038/s41587-021-00927-2
- ↵Persad S, Choo Z-N, Dien C, Sohail N, Masilionis I, Chaligné R, Nawy T, Brown CC, Sharma R, Pe’er I, et al. 2023. Seacells infers transcriptional and epigenomic cellular states from single-cell genomics data. Nat Biotechnol 41: 1746–1757. 10.1038/s41587-023-01716-9
- ↵Song Q, Su J, Zhang W. 2021. scGCN is a graph convolutional networks algorithm for knowledge transfer in single cell omics. Nat Commun 12: 3826. 10.1038/s41467-021-24172-y
- ↵Stuart T, Srivastava A, Madad S, Lareau CA, Satija R. 2021. Single-cell chromatin state analysis with Signac. Nat Methods 18: 1333–1341. 10.1038/s41592-021-01282-5
- ↵Tarazona S, Arzalluz-Luque A, Conesa A. 2021. Undisclosed, unmet and neglected challenges in multi-omics studies. Nat Comput Sci 1: 395–402. 10.1038/s43588-021-00086-z
- ↵Welch JD, Hartemink AJ, Prins JF. 2017. MATCHER: manifold alignment reveals correspondence between single cell transcriptome and epigenome dynamics. Genome Biol 18: 138. 10.1186/s13059-017-1269-0
- ↵Yan X, Zheng R, Chen J, Li M. 2023. scNCL: transferring labels from scRNA-seq to scATAC-seq data with neighborhood contrastive regularization. Bioinformatics 39: btad505. 10.1093/bioinformatics/btad505
- ↵Yang M, Yang Y, Xie C, Ni M, Liu J, Yang H, Mu F, Wang J. 2022. Contrastive learning enables rapid mapping to multimodal single-cell atlas of multimillion scale. Nat Mach Intell 4: 696–709. 10.1038/s42256-022-00518-z
- ↵Zhang Z, Yang C, Zhang X. 2022. scDART: integrating unmatched scRNA-seq and scATAC-seq data and learning cross-modality relationship simultaneously. Genome Biol 23: 139. 10.1186/s13059-022-02706-x
- ↵Zhao J, Wang G, Ming J, Lin Z, Wang Y, Wu AR, Yang C. 2022. Adversarial domain translation networks for integrating large-scale atlas-level single-cell datasets. Nat Comput Sci 2: 317–330. 10.1038/s43588-022-00251-y
- ↵Zheng R, He Y, Huang J, Kan S, Wang H, Wang E, Li M. 2025. A flexible data-driven framework for correcting coarsely annotated scRNA-seq data. Big Data Min Anal 8: 997–1010. 10.26599/BDMA.2025.9020009