
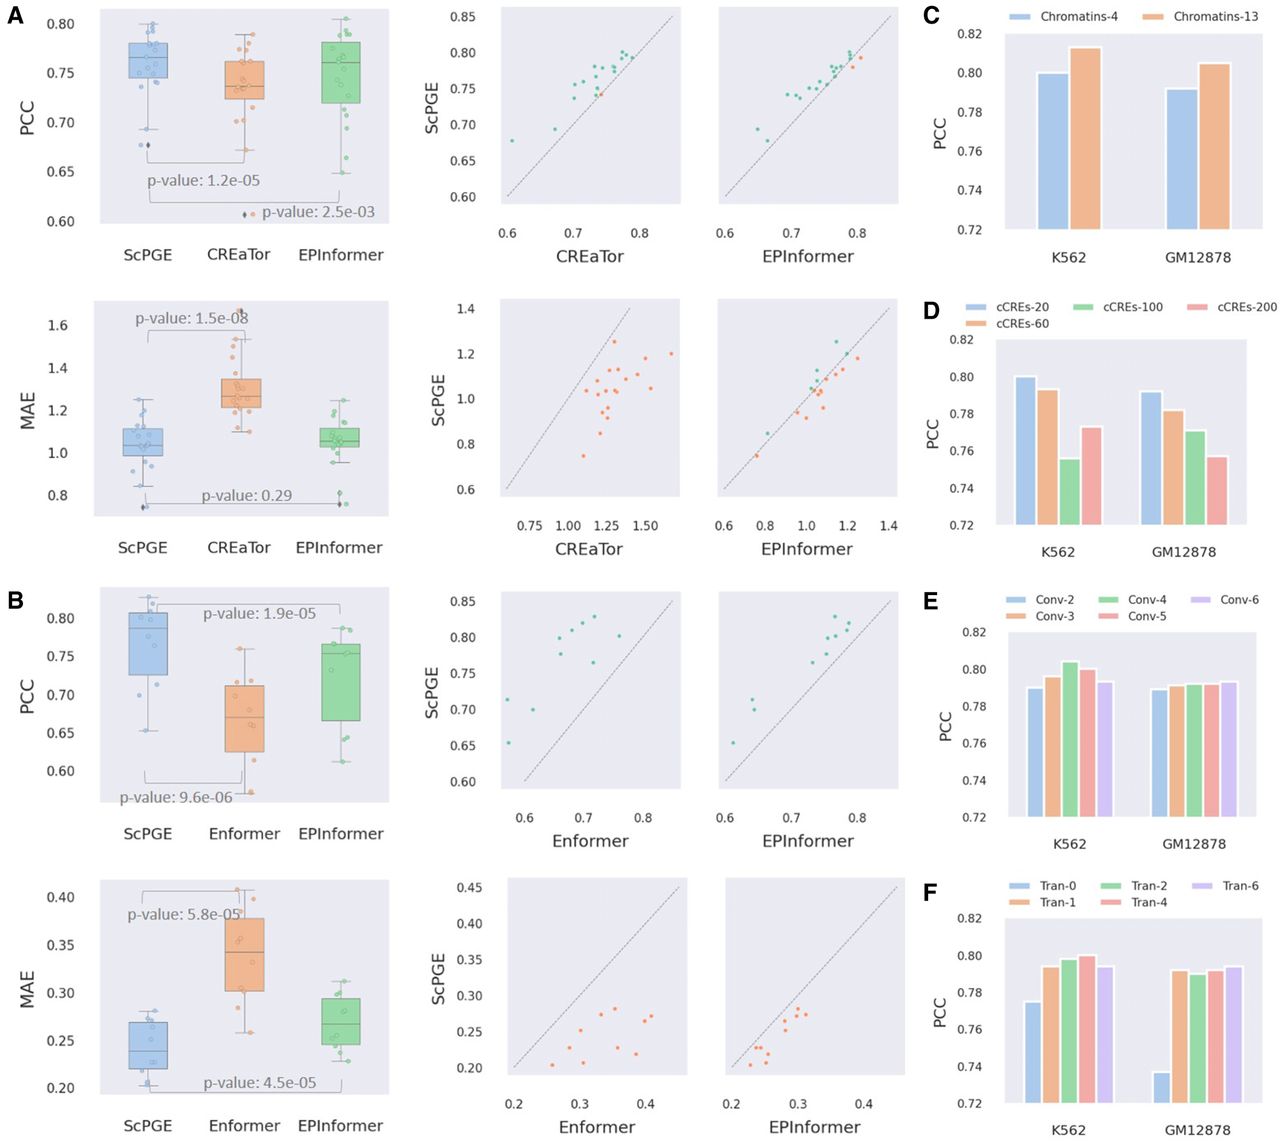
Figure 2.
Overall performance of ScPGE. (A) The performance of ScPGE in predicting RNA-seq gene expression levels, which was measured by PCC and MAE. (B) The performance of ScPGE in predicting CAGE-seq gene expression levels, which was measured by PCC and MAE. The P-value is calculated using Student's t-test. (C–F) The performance (PCC) of ScPGE's scalability by modifying the number of epigenomic tracks, the number of cCREs, and the structure of ScPGE.


