
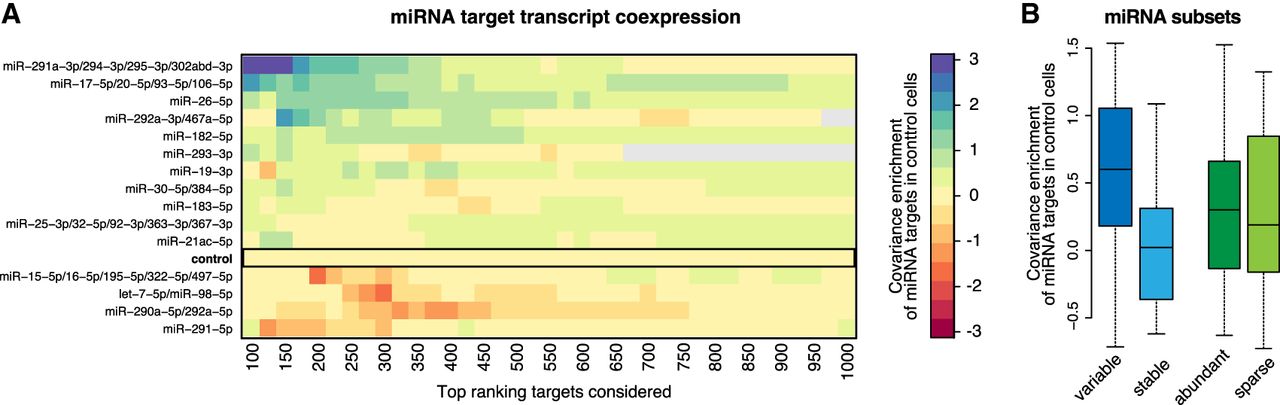
Expression covariation of miRNA targets in single mESCs. (A) Heatmap of miRNA target covariation across single cells. The covariation enrichment was performed as previously described (Tarbier et al. 2020). Blue color indicates mRNAs that are coexpressed more frequently than expected by chance; red color indicates mRNAs that are coexpressed less frequently than expected by chance. (B) Covariance enrichment for targets of miRNAs belonging to different groups, considering the top expressed 16 miRNA families. “Variable” indicates the eight miRNA families with the highest expression variation, and “stable” indicates the eight miRNA families with the most stable expression. “Abundant” indicates the eight top expressed miRNA families, and “sparse” indicates the eight least expressed miRNA families among this set.


