
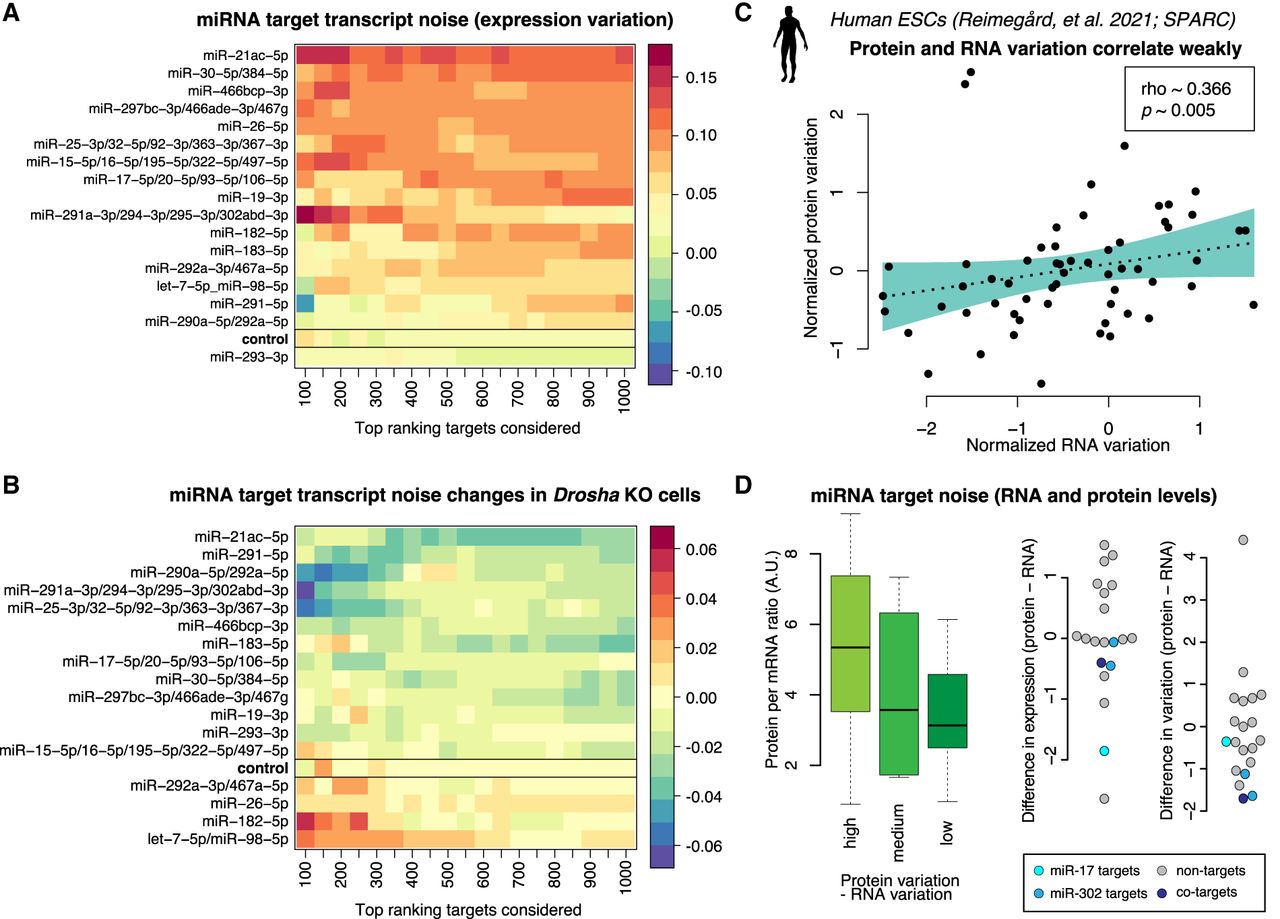
Expression variation of miRNA targets in single mESCs. (A) Heatmap of miRNA target expression variation across single cells, without perturbation and not sorted into G2/M cell phase. The color code indicates expression variation (noise) as estimated by coefficient of variation squared (CV2) residuals (Methods). Red color indicates that the targets of the miRNA are naturally more variable. (B) As in A, but showing changes in expression variation following Drosha knockout. Blue color indicates miRNAs whose targets decrease in variation upon the loss of the DROSHA biogenesis protein. (C) Expression variation for select genes at the RNA and protein level. Measurements were performed using combined single-cell RNA and protein profiling in the same single human embryonic stem cells (Reimegard et al. 2021). (Lower left) Estimated translational efficiency and expression noise. The normalized RNA variation was for select genes subtracted from the normalized protein variation, and the genes were divided into three groups: genes with higher protein variation, genes with comparable RNA and protein variation, and genes with higher RNA variation. For each group, the estimated translational efficiency (Methods) was plotted. (D) Difference between protein and RNA expression and difference between protein and RNA variation. Background nontarget genes were selected to have similar expression as the targets and are marked in gray, and miR-17 and miR-302 targets were marked in light blue and blue, respectively. Genes that are regulated by both miRNAs are marked in dark blue.


