
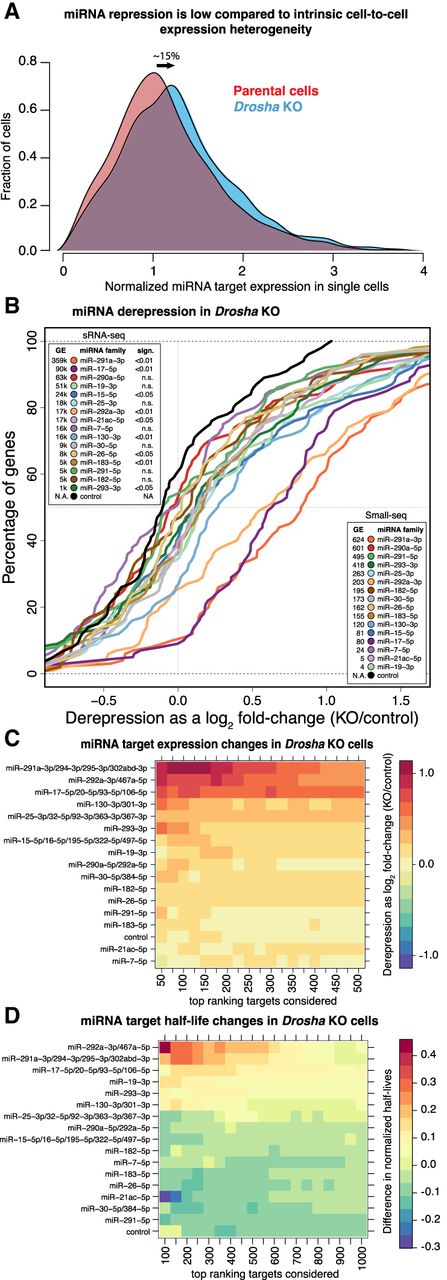
miRNA target repression in single cells. (A) Expression of miRNA targets in cells devoid of miRNAs (Drosha KO) and control cells (parental). The expression is normalized so that a cell with mean expression for the given target is assigned an expression value of one. The density plot is made of a compound of the predicted TargetScan targets for the top 10 expressed miRNAs in mESCs (Methods). The mean expression of the targets is upregulated (derepressed) by ∼15% in the Drosha KO cells. (B) Cumulative distribution function (CDF) plots of the expression of the targets of top miRNAs in mESCs. The inset boxes show miRNA expression ranks according to bulk small RNA-seq (upper left corner) and Small-seq (lower right corner). (C) Heatmap of miRNA target derepression in Drosha KO versus control cells. The color indicates the log fold-change in expression, with red indicating stronger derepression. The targets are sorted according to confidence level, as estimated by the TargetScan cumulative score. (D) As in C, but showing changes to transcript half-lives in Drosha KO versus control cells.


