
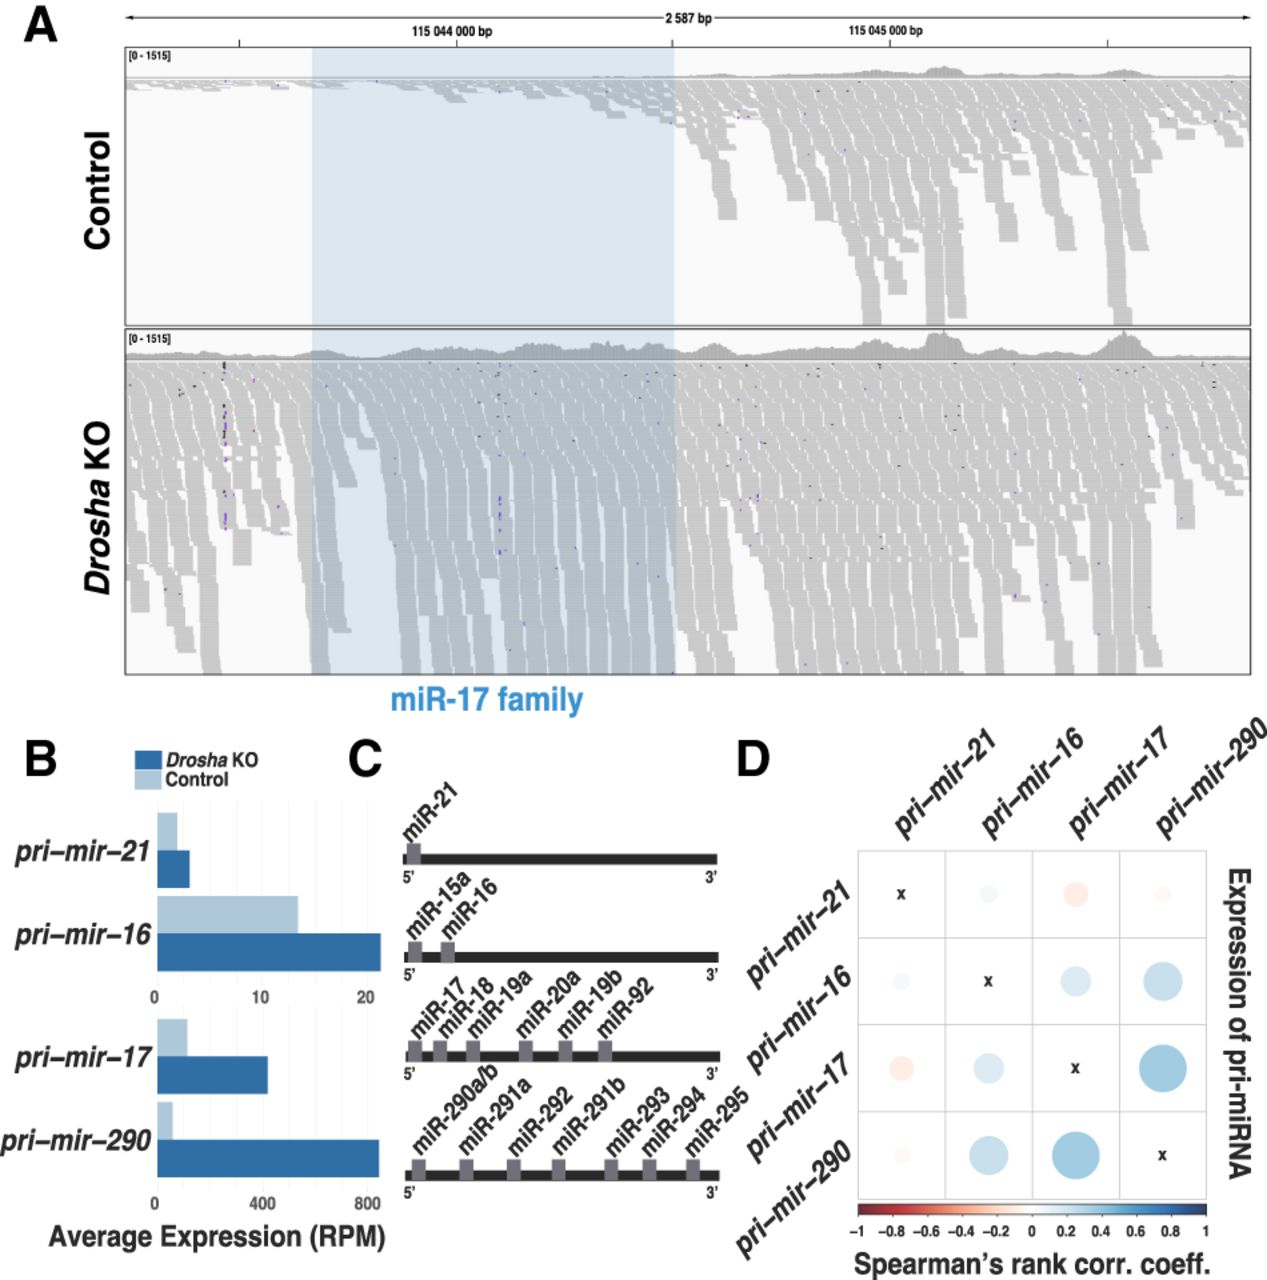
Expression covariation of miRNA primary transcripts. (A) Genome browser shot of miRNA primary transcripts from the mir-17 cluster sequenced by Smart-seq2. The clustered miRNAs (in blue shading) are cleaved out in the control cells (above) but are retained in the Drosha KO cells (below). Each gray shading indicates one sequence read; the 3′ end of the primary miRNA is to the right. (B) miRNA primary transcript expression in control and Drosha KO cells. (C) Schematic of mature miRNAs that are part of the same miRNA primary transcript (transcribed from the same genomic cluster). (D) Expression covariation of miRNA primary transcripts. The color code indicates the Spearman's rank correlation coefficient value. Blue color indicates positively covarying primary transcripts.


