
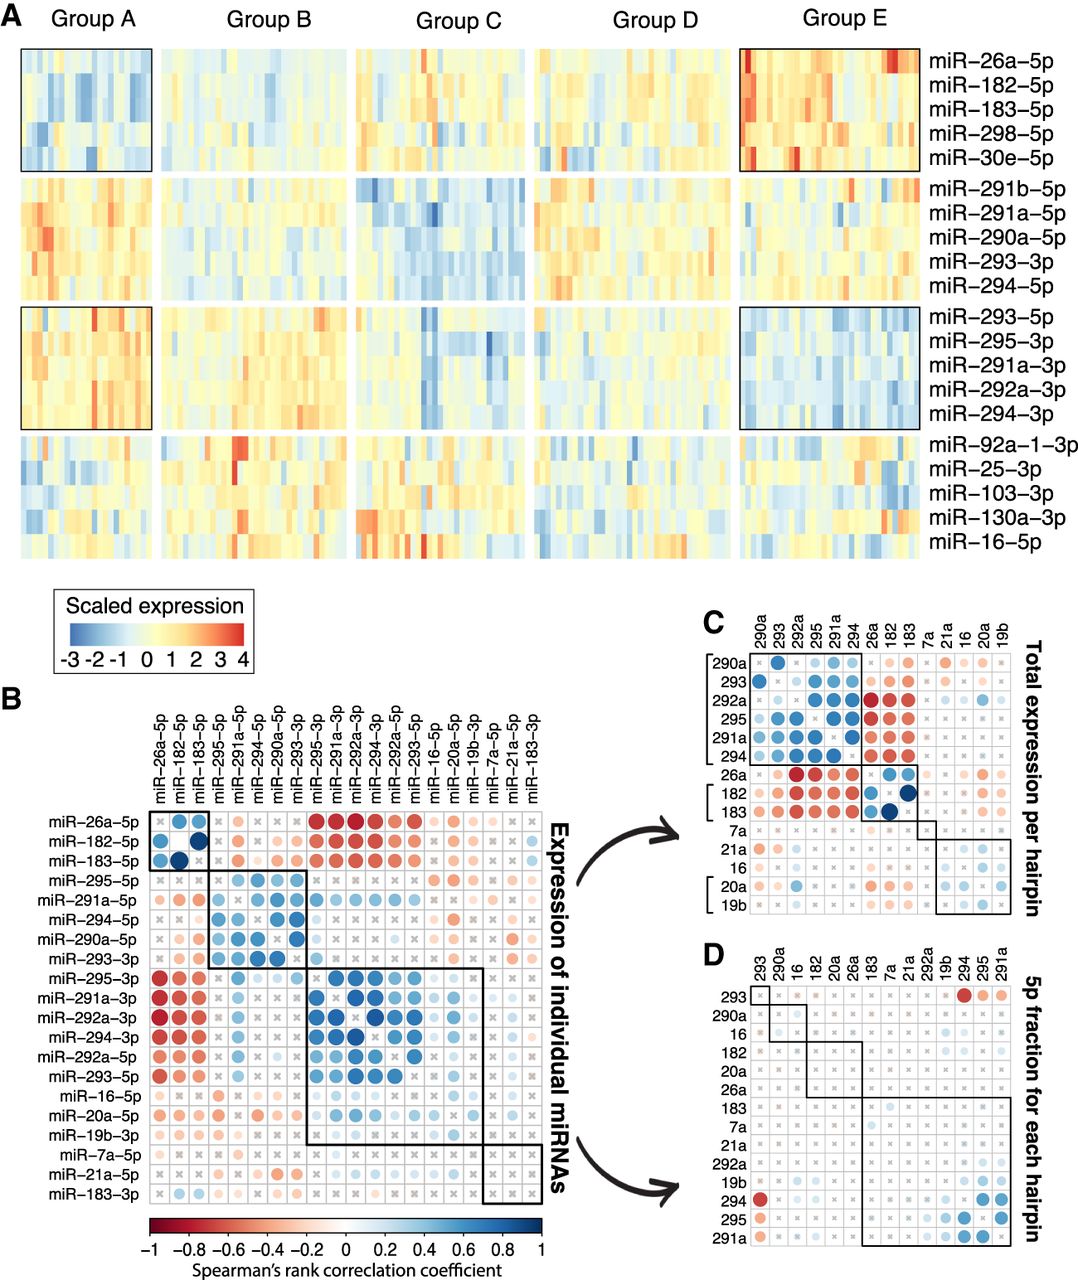
miRNA expression covariation across single mESCs. (A) Four distinct miRNA coexpression groups across 192 cells. The miRNAs (rows) and cells (columns) were grouped using unsupervised hierarchical clustering. Red color indicates high expression relative to the mean for the given miRNAs; blue color indicates low expression. (B) Correlation between expression of miRNA strands. Blue color indicates positive correlation, and red indicates negative correlation. (C) As in B, but summing expression from 5′ and 3′ arms of each miRNA hairpin. (D) As in B, but the correlation was done on the fraction of sequenced RNAs that originate from the 5′ arm of the hairpin. Blue color indicates that the two miRNA hairpins have similar arm select across the cells, and red color indicates that the two hairpins have opposite arm selection across cells.


