
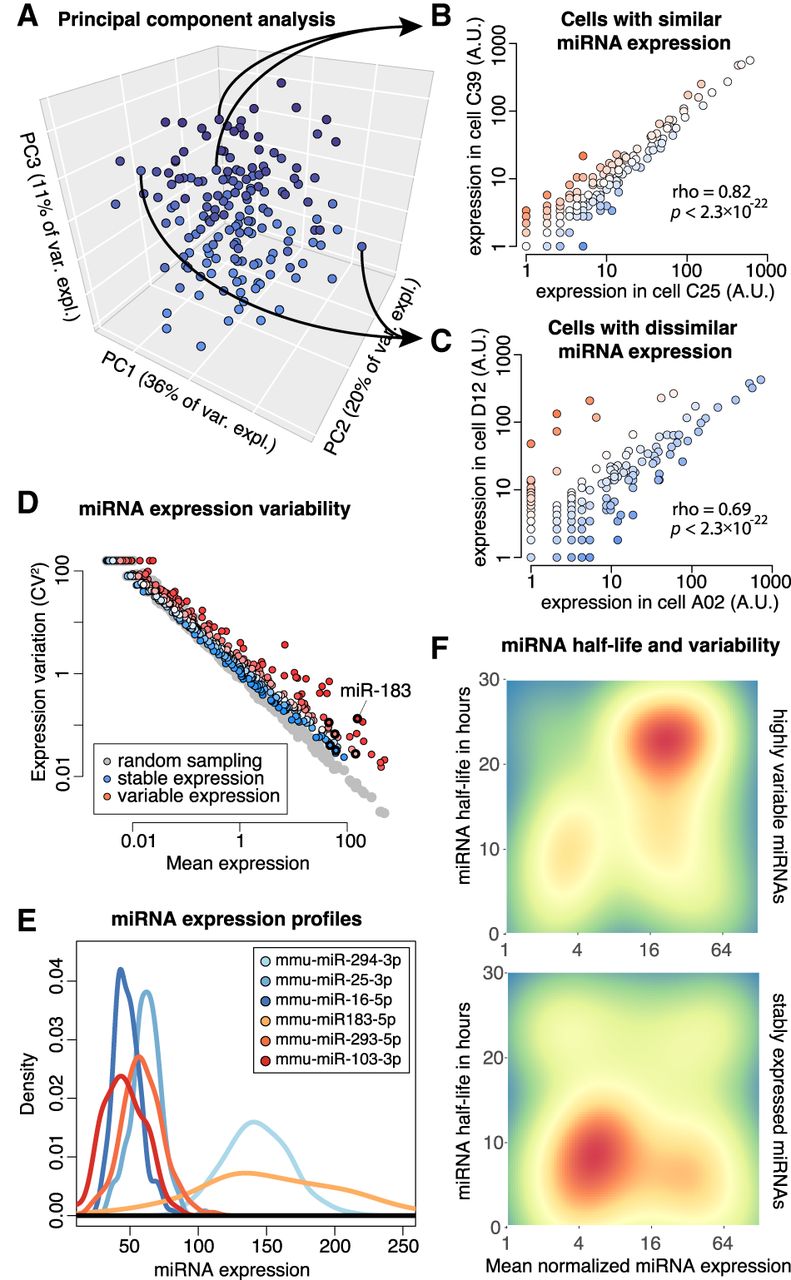
miRNA expression variation across single mESCs. (A) Principal component analysis (PCA) of 192 single cells by their miRNA expression profiles. (B) Comparison of miRNA expression between two cells with similar profiles. Each dot indicates expression of one miRNA. (C) Comparison of miRNA expression between two cells with dissimilar profiles. (D) miRNA mean expression versus expression variation. Each dot indicates one miRNA. Red color indicates variably expressed miRNAs, and blue indicates stable expressed miRNAs. The gray dots are generated by random Poisson sampling and indicate expected technical noise. Specifically, for each miRNA, the actual mean expression across cells was plotted, whereas the variation was randomly sampled from a Poisson distribution, using the mean expression as the Poisson parameter λ. (E) Expression of six select variable (red) and stable (blue) miRNAs across 192 cells. The density profiles are smoothened. (F) Heatmaps of variably expressed (top) and stably expressed (bottom) miRNAs, indicating mean expression versus miRNA half-life. Red color indicates the presence of several miRNAs with those features; blue color indicates the absence of miRNAs with those features.


