
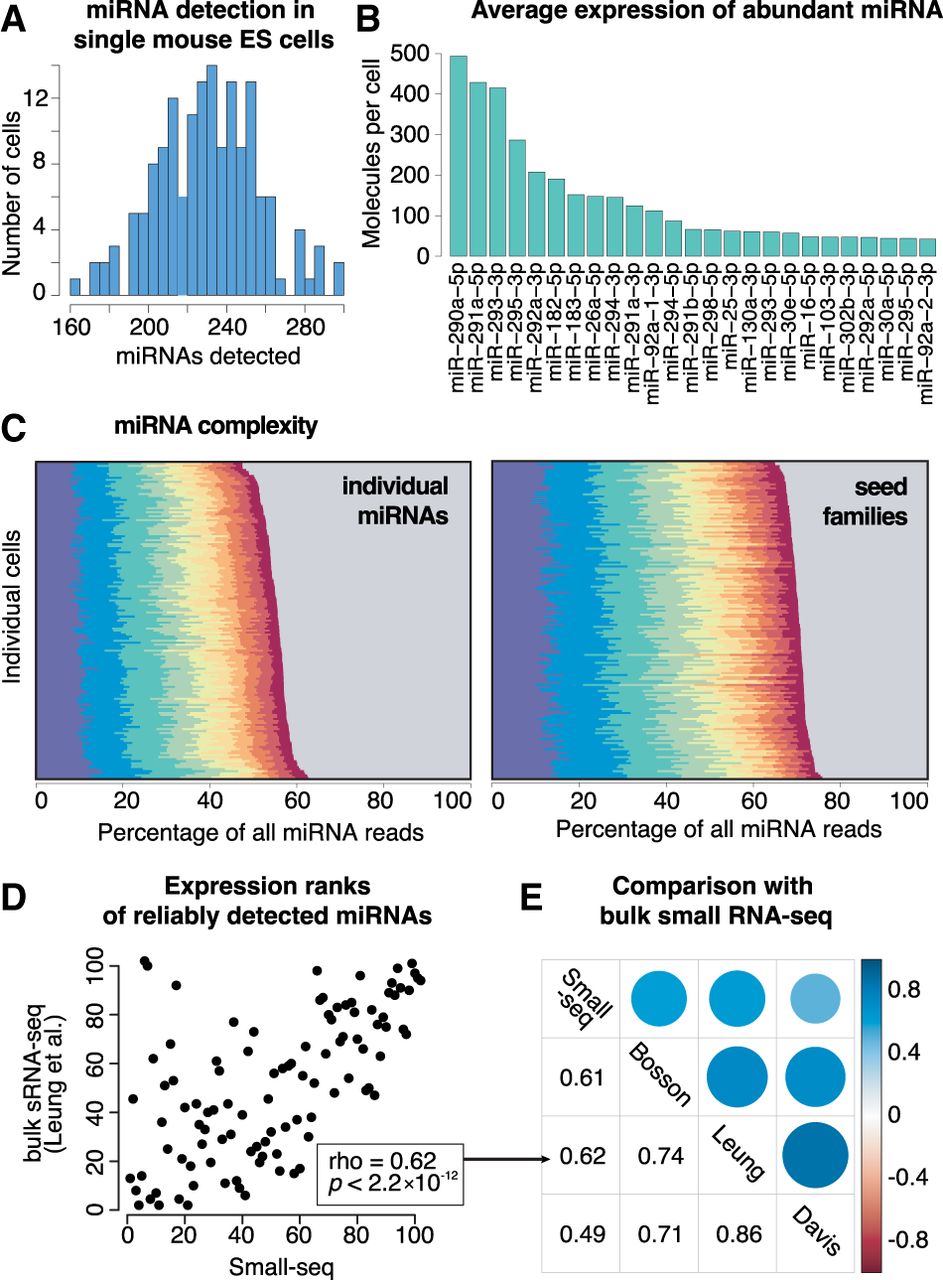
miRNA profiling in single mouse embryonic stem cells (mESCs) by Small-seq. (A) Number of distinct miRNAs detected in each single cell. (B) Top 25 miRNAs in mESCs. The number of detected molecules was estimated using unique molecular identifiers (UMIs) to resolve PCR duplicates. (C) Expression of top 10 miRNAs in 192 individual single cells. The gray area represents the contribution of all miRNAs other than the top 10 ones. (Left) Individual miRNAs: miR-290a-5p, miR-291a-5p, miR-293-3p, miR-295-3p, miR-292a-3p, miR-182-5p, miR-183-5p, miR-26a-5p, miR-294-3p, and miR-291a-3p. (Right) Families: miR-291a-3p/294-3p/295-3p/302abd-3p, miR-290a-5p/292a-5p, miR-291-5p, miR-293-3p, miR-25-3p/32-5p/92-3p/363-3p/367-3p, miR-292a-3p/467a-5p, miR-182-5p, miR-30-5p/384-5p, miR-26-5p, and miR-183-5p. (D) Expression rank of miRNAs detecting in mESCs by Small-seq and bulk small RNA-seq (Leung et al. 2011). Lower rank means higher expression. (E) Spearman's rank correlation coefficient between miRNA expression as profiled by Small-seq and three representative bulk small RNA-seq data sets (Leung et al. 2011; Davis et al. 2012; Bosson et al. 2014).


