
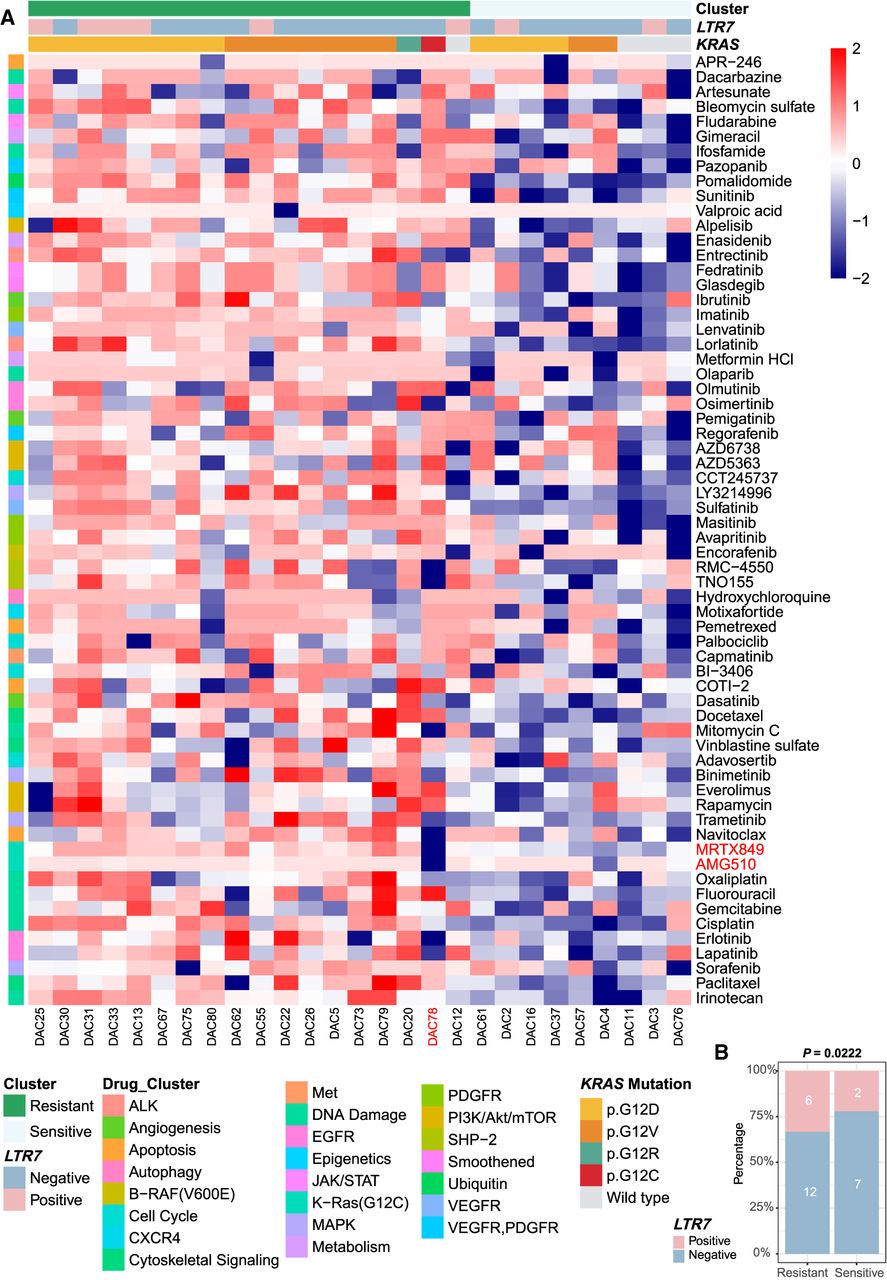
Figure 7.
Drug sensitivity profiles of PAAD organoids. (A) Drug response of 35 PAAD organoids to 64 different drugs. Colors ranging from red to blue represent Z-scores based on the Area Under the Curve (AUC). A low Z-score (blue) indicates high drug sensitivity, whereas a high Z-score (red) indicates high resistance. The positive control is highlighted in red font for clarity. (B) Stacked bar chart displaying the distribution of LTR7 in different states across two groups with χ2 test (Bonferroni correction applied).


