
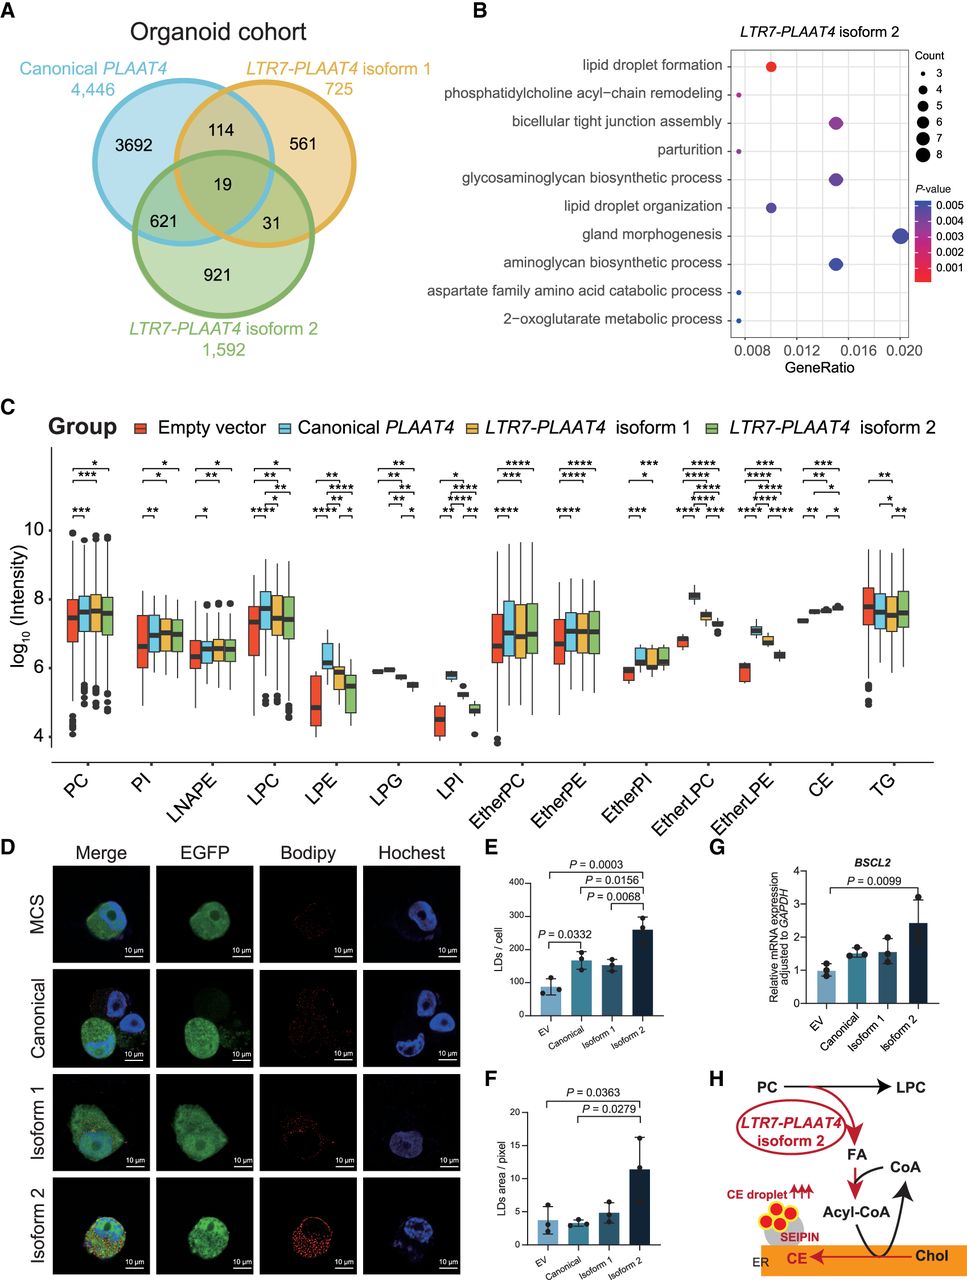
Potential oncogenic mechanism of LTR7-PLAAT4 isoform 2 in pancreatic cancer. (A) Venn diagram showing the number of genes positively correlated with different PLAAT4 isoforms in organoid cohort. The canonical PLAAT4, LTR7-PLAAT4 isoform 1, and LTR7-PLAAT4 isoform 2 are marked in light blue, yellow, and green, respectively. (B) Gene Ontology analysis of specific genes correlated with LTR7-PLAAT4 isoform 2. The size of each bubble represents the number of enriched genes, and the color indicates the P-value, with darker colors representing smaller P-values. (C) Lipidomics analysis of PANC-1 cells overexpressing LTR7-PLAAT4 isoform 1, LTR7-PLAAT4 isoform 2, and canonical PLAAT4. Box plots display the distribution of different PLAAT4 isoforms across various lipid classes. Each box plot includes the median, interquartile range, and outliers for the lipid classes measured. Statistical significance is indicated with (*) P ≤ 0.05, (**) P ≤ 0.01, (***) P ≤ 0.001, (****) P ≤ 0.0001. The exact P-values of panel C are listed in Supplemental Table S6. (D) PANC-1 cells imaged after 24 h of methyl-ß-cyclodextrin complexed cholesterol (200 µM) feeding. BODIPY was added upon imaging for LD labeling and analysis. (E) Analysis of D. Number of LDs per cell. (F) Analysis of D. Area of LDs per pixel. The experiment was independently repeated three times with similar results. (G) Expression of BSCL2 in different PLAAT4 isoforms overexpressed pancreatic cancer cell lines (PANC-1) measured by qPCR. (H) Schematic illustrating the special oncogenic role of LTR7-PLAAT4 isoform 2 in PAAD.


