
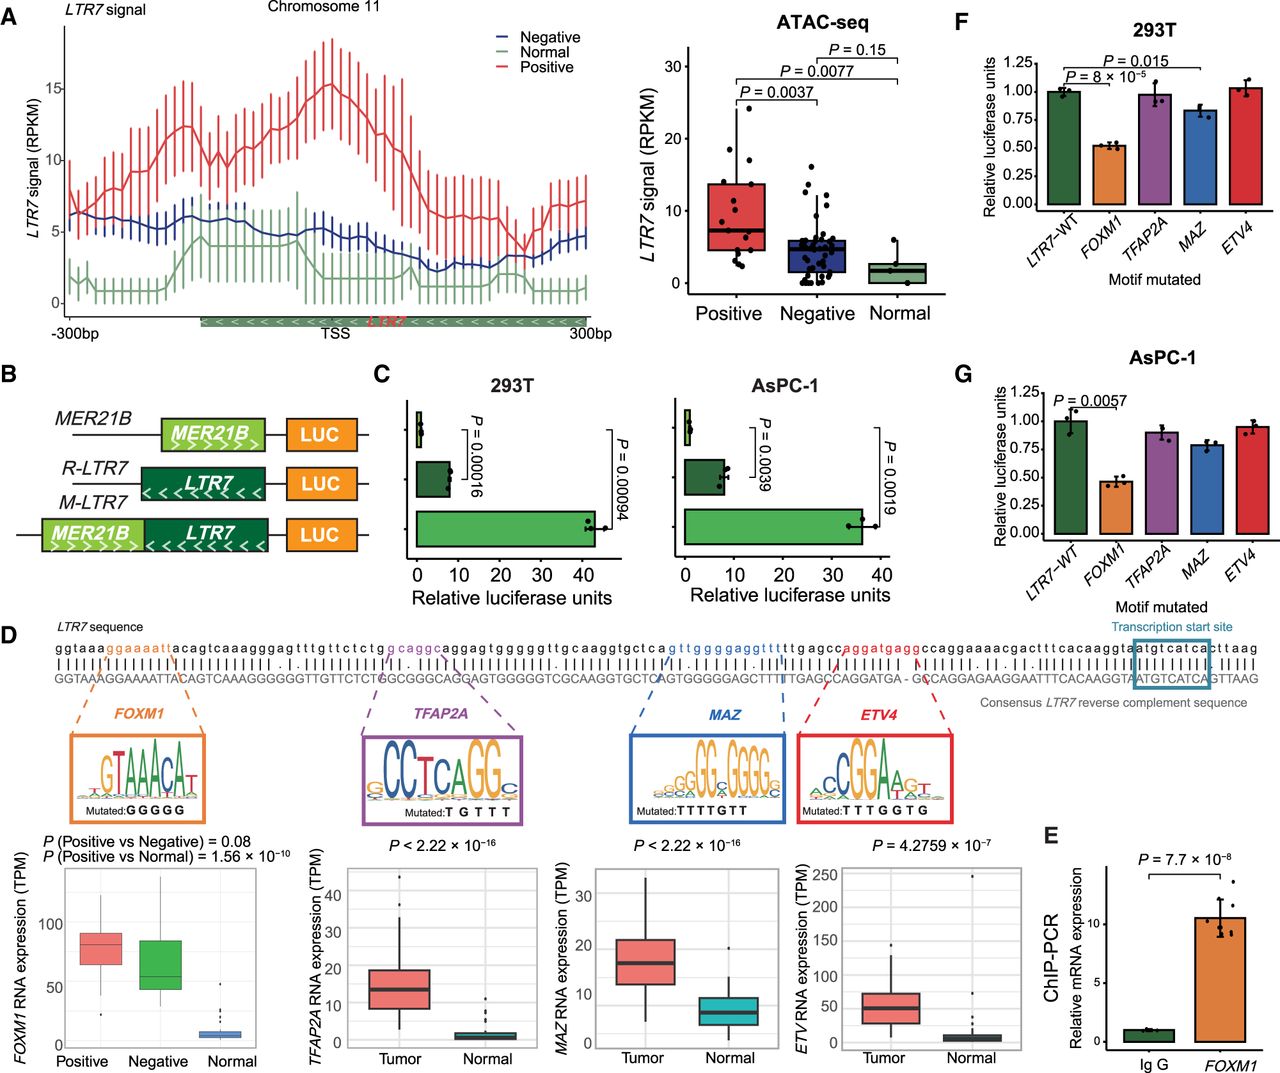
LTR7 drives PLAAT4 expression in pancreatic cancer. (A) Line plot displaying the ATAC-seq data signal within ±300-bp range upstream of and downstream from the LTR7 transcript start site. The red line represents tumor organoids with LTR7-PLAAT4 (n = 17), the blue line represents tumor organoids without LTR7-PLAAT4 (n = 45), and the green line represents normal organoids (n = 5) (left). Statistical analysis was performed using a t-test for each group comparison (right). (B,C) Luciferase assays evaluating the transcriptional activity of different TE arrangements in 293T cells (left) and AsPC-1 cells (right) (n = 3 independent experiments), with statistical analysis conducted using a t-test. (D) Schematic illustration of luciferase reporter assays measuring LTR7 promoter activity with mutated transcription factor binding motifs. (E) Quantification of FOXM1 enrichment in AsPC-1 cells by ChIP-PCR analysis. (F) Luciferase assays for promoter activity in 293T with mutagenized transcription factor motifs in LTR7 (n = 3 independent experiments). Box plots of RNA expression of transcription factor among different groups, with statistical analysis performed using t-tests. (G) Same as F but in AsPC-1 cells. All data are represented as means ± standard error (s.e.m.).


