
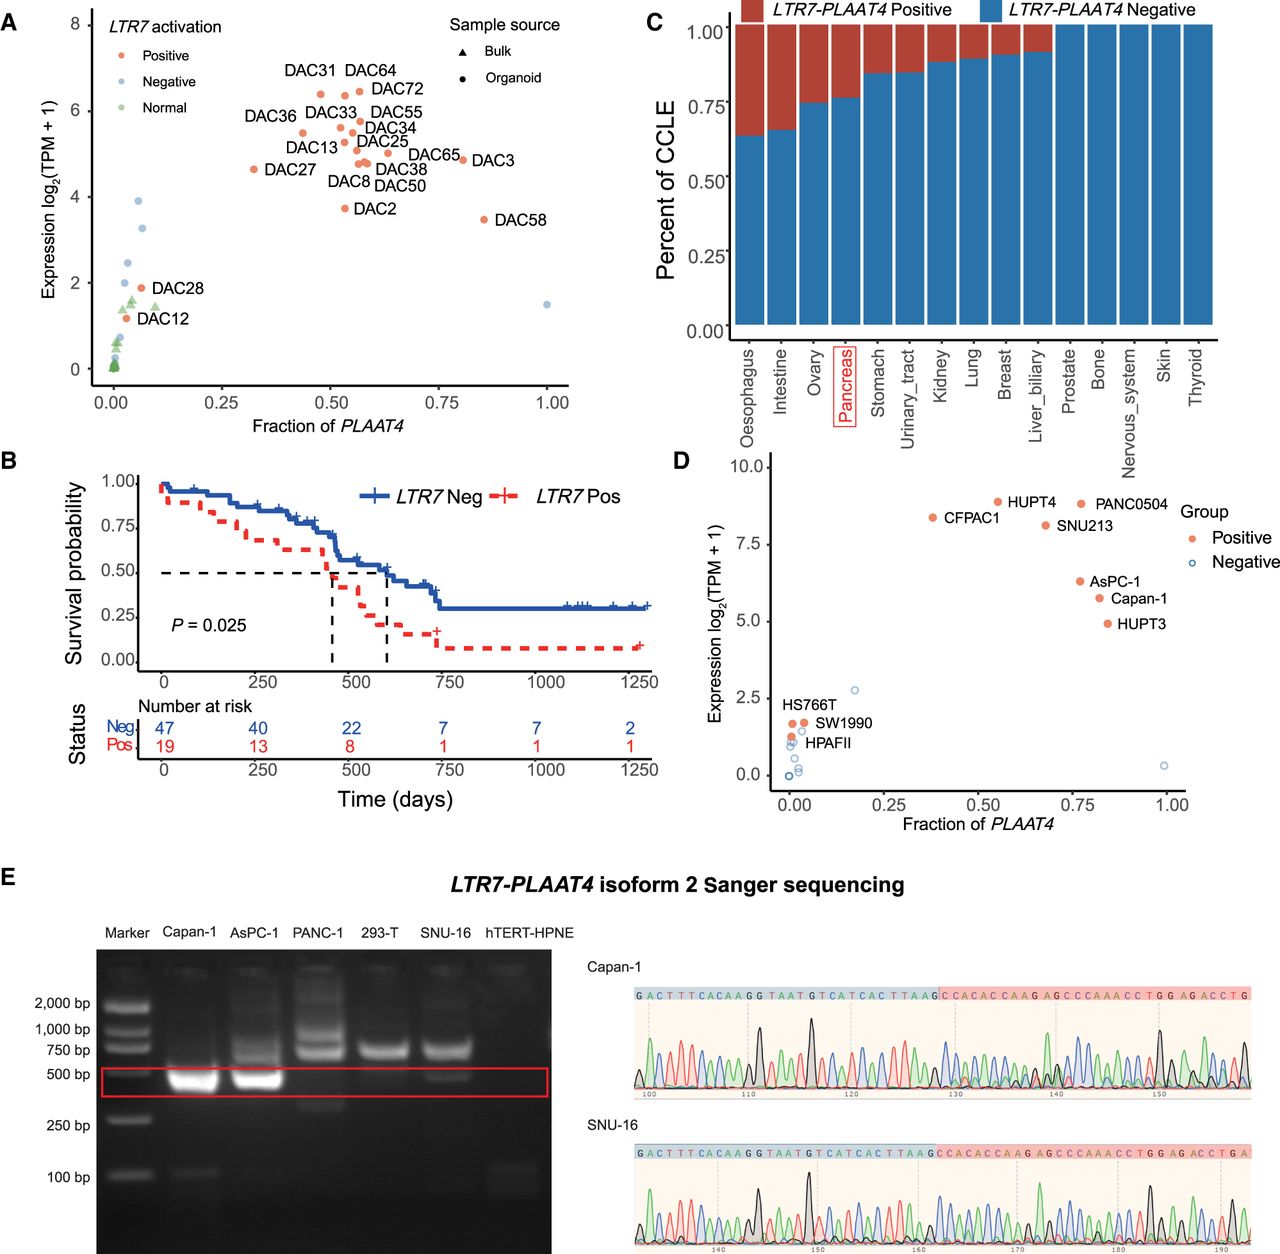
Expression profiling of LTR7-PLAAT4 across PAAD organoids and various cancer cell lines. (A) Scatterplot illustrating the expression and fraction distribution of LTR7-PLAAT4 across organoids and bulk samples (n = 110). Orange represents tumor samples positive for LTR7-PLAAT4; blue represents tumor samples negative for LTR7-PLAAT4 (lacking supporting splicing reads or with expression level <1 TPM); green represents normal samples; triangles and circles denote bulk samples and organoid samples, respectively. (B) Comparison of overall survival (OS) between the groups with and without LTR7-PLAAT4 existence in the organoid cohort (n = 66), assessed using the log-rank test. (C) Frequency distribution bar plot of the LTR7-PLAAT4 identified in CCLE cancer cell lines data sets, arranged from left to right based on the frequency of detection in cell lines (n = 685). (D) Expression and fraction distribution of LTR7-PLAAT4 across pancreatic cancer cell lines (n = 41). (E) PCR results following nested PCR were obtained for Capan-1, AsPC-1, and SNU-16 cell lines (which tested positive for LTR7-PLAAT4 isoform 2), as well as for PANC-1, 293-T, and hTERT-HPNE cell lines (which tested negative for LTR7-PLAAT4 isoform 2). Representive Sanger sequencing results of Capan-1 and SNU-16 were displayed.


