
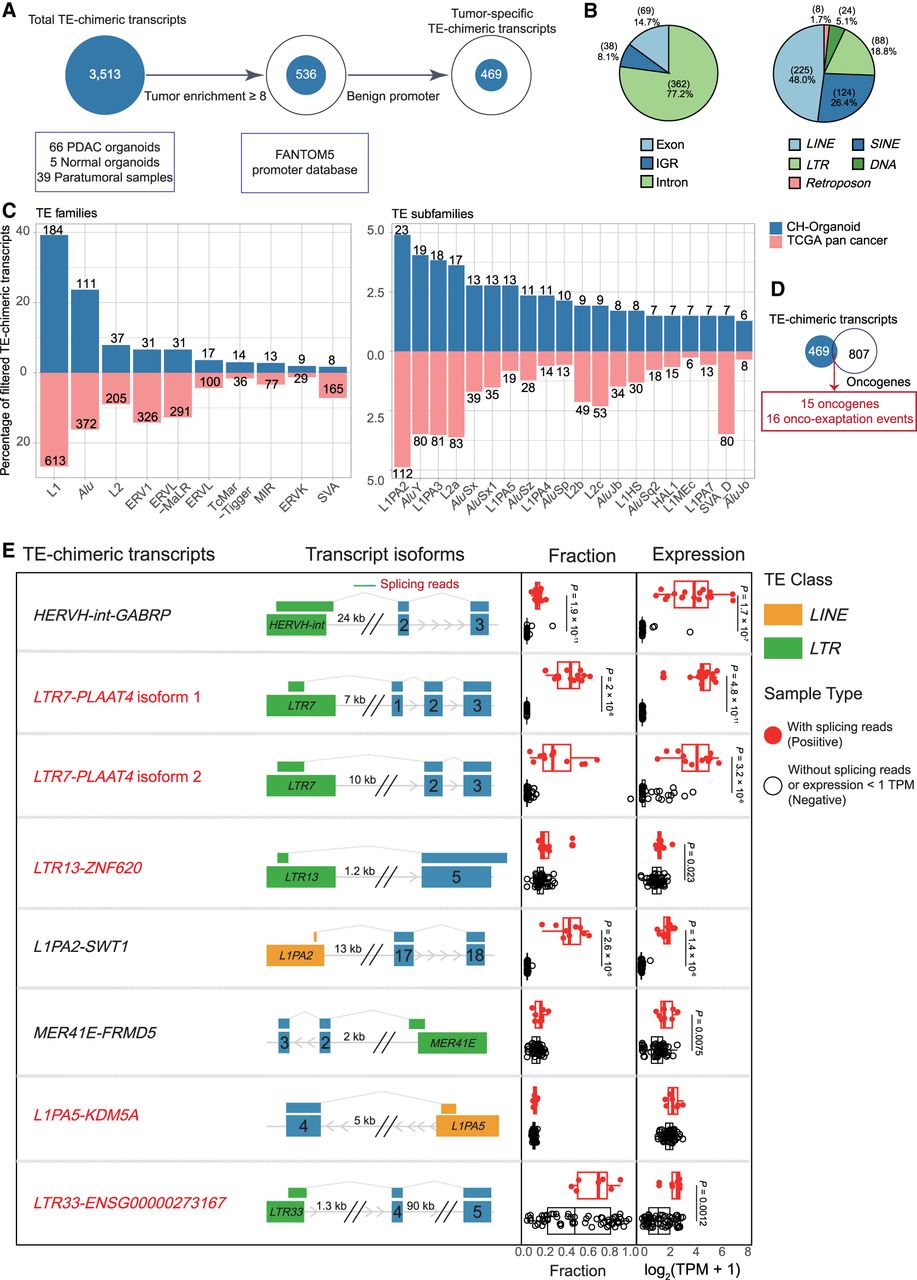
Identification of tumor-specific and clinically prognostic TE-chimeric transcripts in PAADs. (A) Diagram illustrating the process of candidate transcript filtering for tumor enrichment using normal organoids and normal bulk samples along with the FANTOM5 promoter atlas. (B) Pie charts depicting the TE location distribution of TE-chimeric transcripts (left) and their distribution across TE classes (right). IGR refers to the intergenic region. (C) Bidirectional bar graphs showing the percentage of families and subfamilies within filtered tumor-associated TE-chimeric transcripts. The upper section represents the in-house organoid cohort, whereas the lower section represents the previously reported TCGA pan-cancer data set. (D) Venn diagram illustrating the intersection between candidates identified in the organoid cohort and the 807 oncogenes based on the ONGene database and as previously reported. (E) The top eight most prevalent candidates significantly associated with patient survival. The left panel provides labels for the TE-chimeric transcripts and diagrams illustrating the transcript structure of each candidate. In the “Fraction” panel, each bar represents the proportion of total gene expression that is attributable to the TE-chimeric transcript, calculated only across the samples in which the candidate is detected. Validated candidates are denoted by red solid circles, whereas candidates lacking supporting evidence in terms of splicing reads or expression levels below 1 TPM are represented by black hollow circles. The “Expression” panel displays the expression levels of samples featuring the onco-exaptation candidate, with the candidate represented by red solid circles. Samples without supporting splicing reads or expression levels below 1 TPM are denoted by black hollow circles. Each box represents the median and interquartile range, with statistical analysis performed using t-tests. TE-chimeric transcripts labeled in red indicate the presence of coding potential.


