
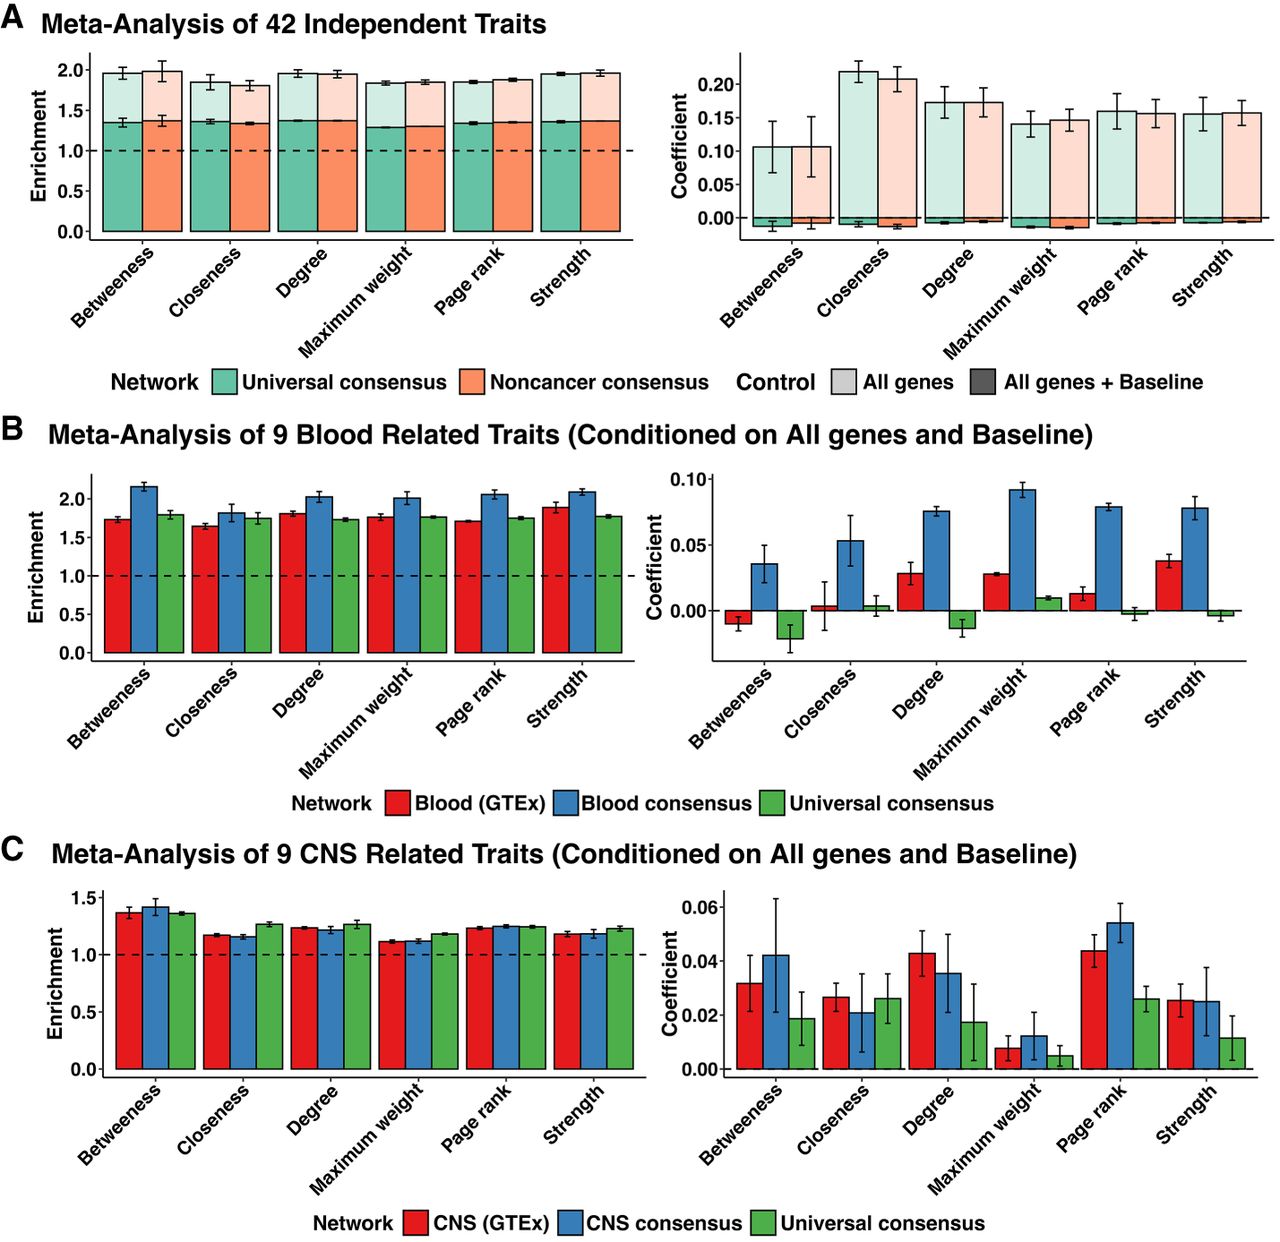
Heritability enrichment of network annotations. Mean and standard deviation of heritability enrichment and the coefficient τ*, an estimate of the heritability of SNPs unique to the annotation. All genes: whether a variant was located in a 100-kb window of all protein-coding genes (translucent), all genes + baseline: all-genes annotation in addition to 97 functional annotations such as known enhancer and promoter regions (opaque). (A) Meta-analysis of 42 independent traits for six centrality measures obtained from the universal consensus network and noncancer consensus networks corresponding to values of the penalization parameter λ between 0.14 and 0.20. (B) Meta-analysis of nine blood-related traits, including Crohn's disease, ulcerative colitis, rheumatoid arthritis, allergy eczema, eosinophil count, red blood cell count, white blood cell count, red blood cell width, and platelet count for network annotations from blood GTEx (λ = 0.24–0.32), Blood consensus (λ = 0.18–0.26), and universal consensus network (λ = 0.14–0.20). (C) Meta-analysis of nine CNS-related traits, including Alzheimer's disease, epilepsy, Parkinson's disease, bipolar disorder, smoking cessation, waist-hip-ratio adjusted BMI, schizophrenia, major depressive disorder, and number of alcoholic drinks per week, for network annotations corresponding to six centrality measures derived from CNS GTEx (λ = 0.26–0.32), CNS (λ = 0.20–0.28), and universal consensus network (λ = 0.14–0.20).


