
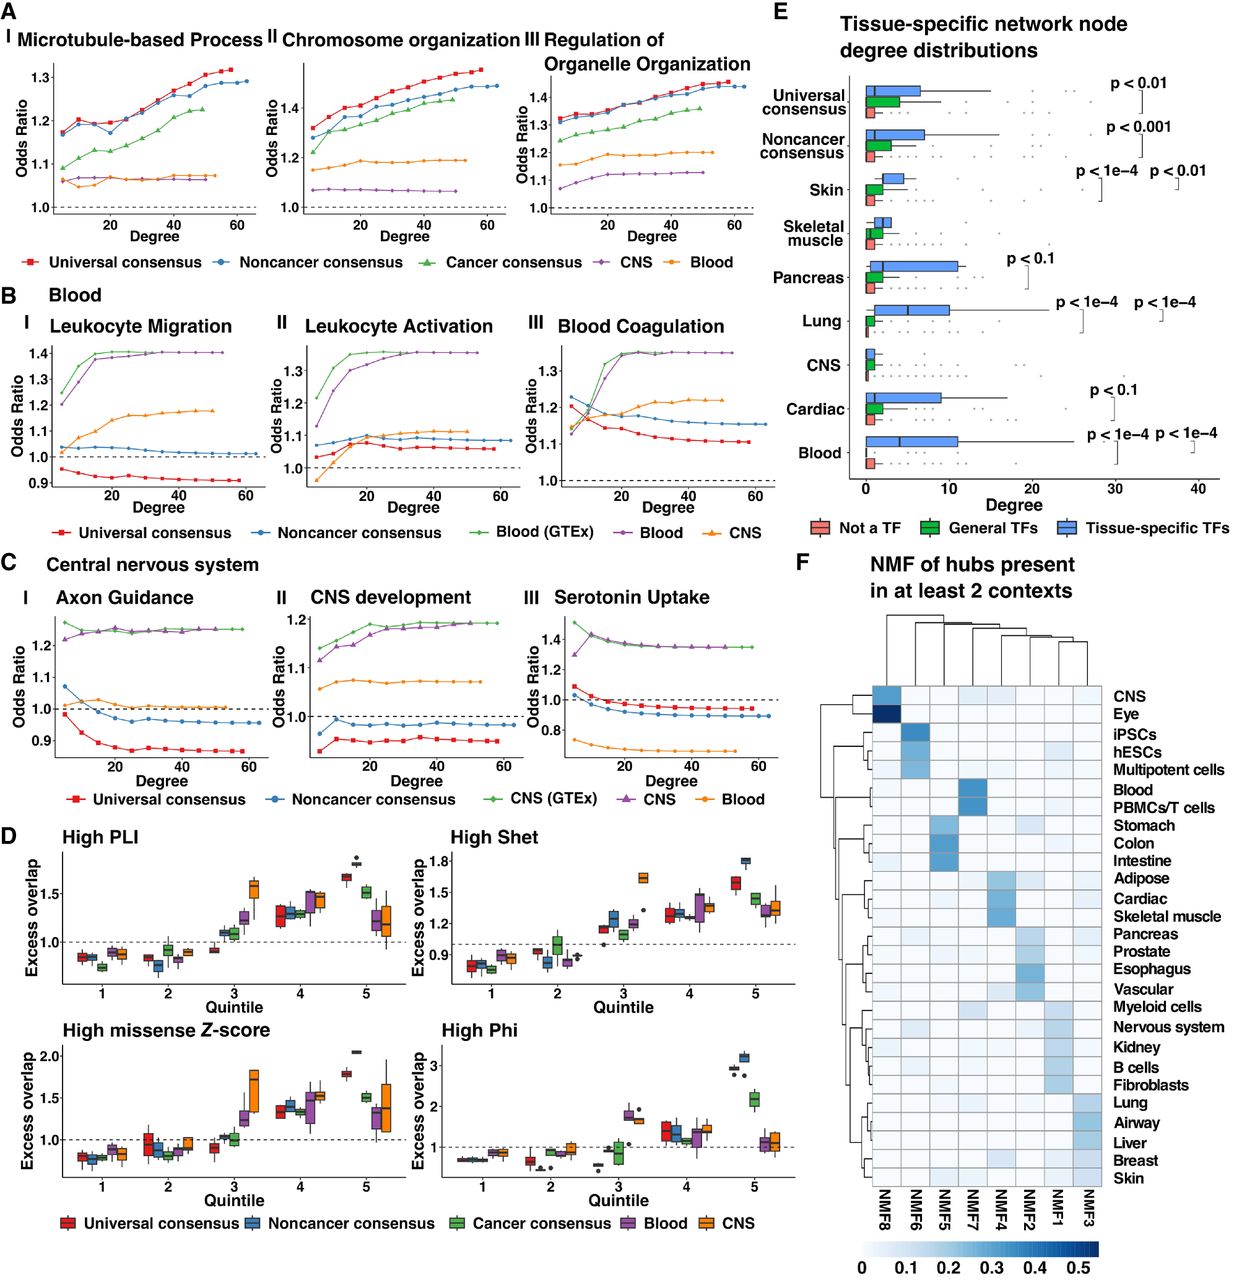
Properties of central network nodes of consensus and context-specific networks. (A–C) Enrichment of genes involved in GO processes among network genes selected with increasing thresholds of node degree in three consensus networks: universal (λ = 0.18, 7087 edges); noncancer (λ = 0.18, 7355 edges); and cancer (λ = 0.24, 7552 edges), as well as two context-specific networks: blood (λ = 0.24, 7283 edges); and CNS (λ = 0.28, 8430 edges). Tissue-context-specific networks were inferred only using noncancerous samples. Blood (GTEx) or CNS (GTEx) networks were inferred using samples only found in GTEx whereas blood and CNS networks were inferred using samples from GTEx and SRA. (D) Distribution of the excess overlap of evolutionarily conserved gene sets (Methods) for network nodes binned by the number of neighbors (degree) corresponding to universal consensus networks (λ = 0.14, 0.16, 0.18, 0.20), noncancer consensus networks (λ = 0.14, 0.16, 0.18, 0.20), cancer consensus networks (λ = 0.20, 0.22, 0.24, 0.26), blood networks (λ = 0.18, 0.20, 0.22, 0.24, 0.26), and CNS networks (λ = 0.24, 0.26, 0.28, 0.30, 0.32). Quintile 1 reflects nodes with no neighbors. Nodes with nonzero neighbors are split based on the degree quartile they belong to (Quintiles 2–5). We evaluated the excess overlap of 3104 loss-of-function (LoF) genes with pLI > 0.9, 2853 genes with a Shet > 0.1, 588 genes with a Phi-score > 0.95, and 1440 genes strongly depleted for missense mutations (high missense Z-score). (E) The degree distribution of network nodes that are tissue-specific transcription factors (TFs) in blood (52 TFs), lung (58 TFs), skin (10 TFs), pancreas (16 TFs), cardiac (17 TFs), muscle (7 TFs), CNS (51 TFs), general transcription factors (88 TFs), and protein-coding genes which are not transcription factors in universal consensus (λ = 0.18, 7087 edges), noncancer consensus (λ = 0.18, 7355 edges), skin (λ = 0.26, 7567 edges), skeletal muscle (λ = 0.26, 6254 edges), pancreas (λ = 0.32, 7615 edges), lung (λ = 0.30, 6349 edges), CNS (λ = 0.30, 6316 edges), cardiac (λ = 0.30, 6481 edges), and blood (λ = 0.24, 7283 edges). Pairs with no significance reported were not statistically distinct (P > 0.1). (F) Factor weights were obtained by nonnegative matrix factorization of the presence of hub genes in tissue-specific networks with ∼ 7000 edges. Details of the penalization parameter λ and the number of edges of selected networks for each tissue context are provided in Supplemental Table S7.


