
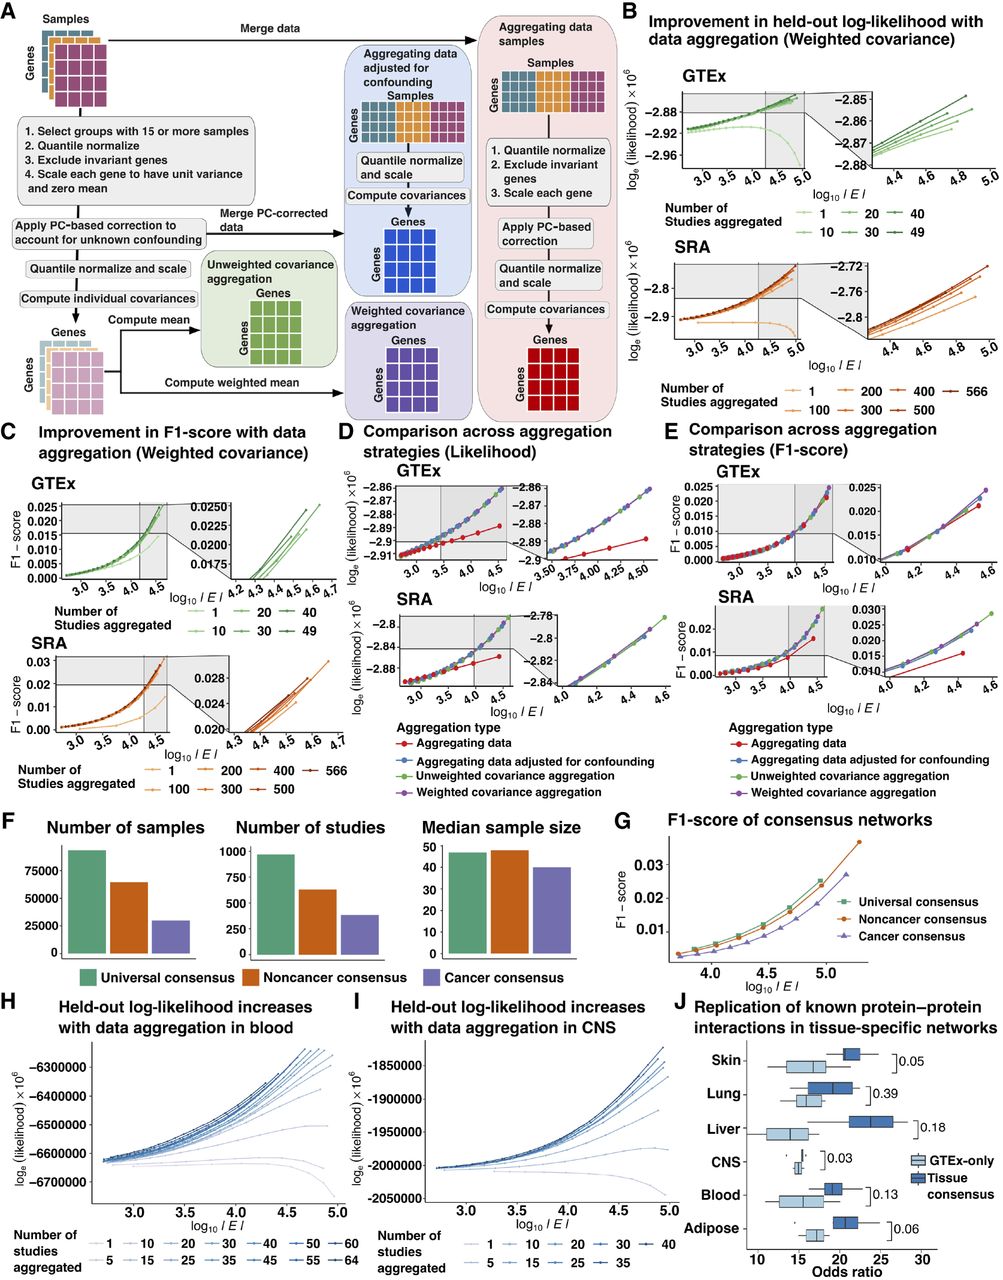
Comparison of aggregation strategies to optimize network reconstruction. (A) Outline of strategies to compare data correction before and after aggregation and weighted and unweighted aggregation of single tissue/ study covariance matrices included: (1) aggregating data before PC-based data correction followed by estimation of empirical covariance from residual expression (aggregating data, orange); (2) PC-based data correction applied to individual studies followed by aggregation of residual expression and joint estimation of empirical covariance (aggregating data adjusted for confounding, brick red); (3) unweighted aggregation of covariance matrices inferred from each study separately after study-specific PC-based correction (unweighted covariance aggregation, purple); and (4) weighted aggregation of covariance matrices computed from individual studies following study-specific PC-based data correction (weighted covariance aggregation, magenta). (B) Held-out log-likelihood of networks inferred by sequentially aggregating either 10 GTEx studies or 100 SRA studies at a time versus the log of the number of edges (|E|) found in networks obtained by varying the penalization parameter λ (C) F1-score of networks inferred by sequentially aggregating either 10 GTEx studies or 100 SRA studies at a time versus the log of the number of edges (|E|) found in networks obtained by varying the penalization parameter λ when compared to canonical pathways compiled from KEGG, Biocarta, and Pathway Interaction Database. (D) Comparison of held-out log-likelihood corresponding to networks inferred over 49 GTEx studies or 566 SRA studies versus the log of the number of edges (|E|) found in networks obtained by varying the penalization parameter λ using four different aggregation strategies including aggregating data, aggregating data adjusted for confounding, unweighted, and weighted aggregation of covariance matrices. (E) Comparison of F1-scores of obtaining edges corresponding to canonical pathways from KEGG, Biocarta, and Pathway Interaction Database in networks inferred over 49 GTEx studies or 566 SRA studies versus the log of the number of edges (|E|) found in networks obtained by varying the penalization parameter λ using four different aggregation strategies including aggregating data, aggregating data adjusted for confounding, unweighted, and weighted aggregation of covariance matrices. (F) Total number of samples, number of individual studies, and the median sample size of each study which were used in the inference of universal consensus, noncancer consensus, and cancer consensus networks. (G) Comparison of F1-scores of obtaining edges corresponding to canonical pathways in the three consensus networks—universal, noncancer, and cancer—across networks with number of edges (|E|) varying between 5 × 10³ and 5 × 10⁶ edges. (H) Log-likelihood of GTEx blood samples based on networks inferred by sequentially aggregating SRA blood studies five at a time for number of edges ranging from 103 to 105 edges. (I) Log-likelihood of GTEx CNS samples based on networks inferred by sequentially aggregating SRA CNS studies five at a time for number of edges ranging from 103 to 105 edges. (J) Odds ratio of finding edges corresponding to tissue-specific protein-protein interactions (PPIs) derived from SNAP in tissue-context-specific networks inferred using all available samples versus only samples found in GTEx for six tissue contexts.


