
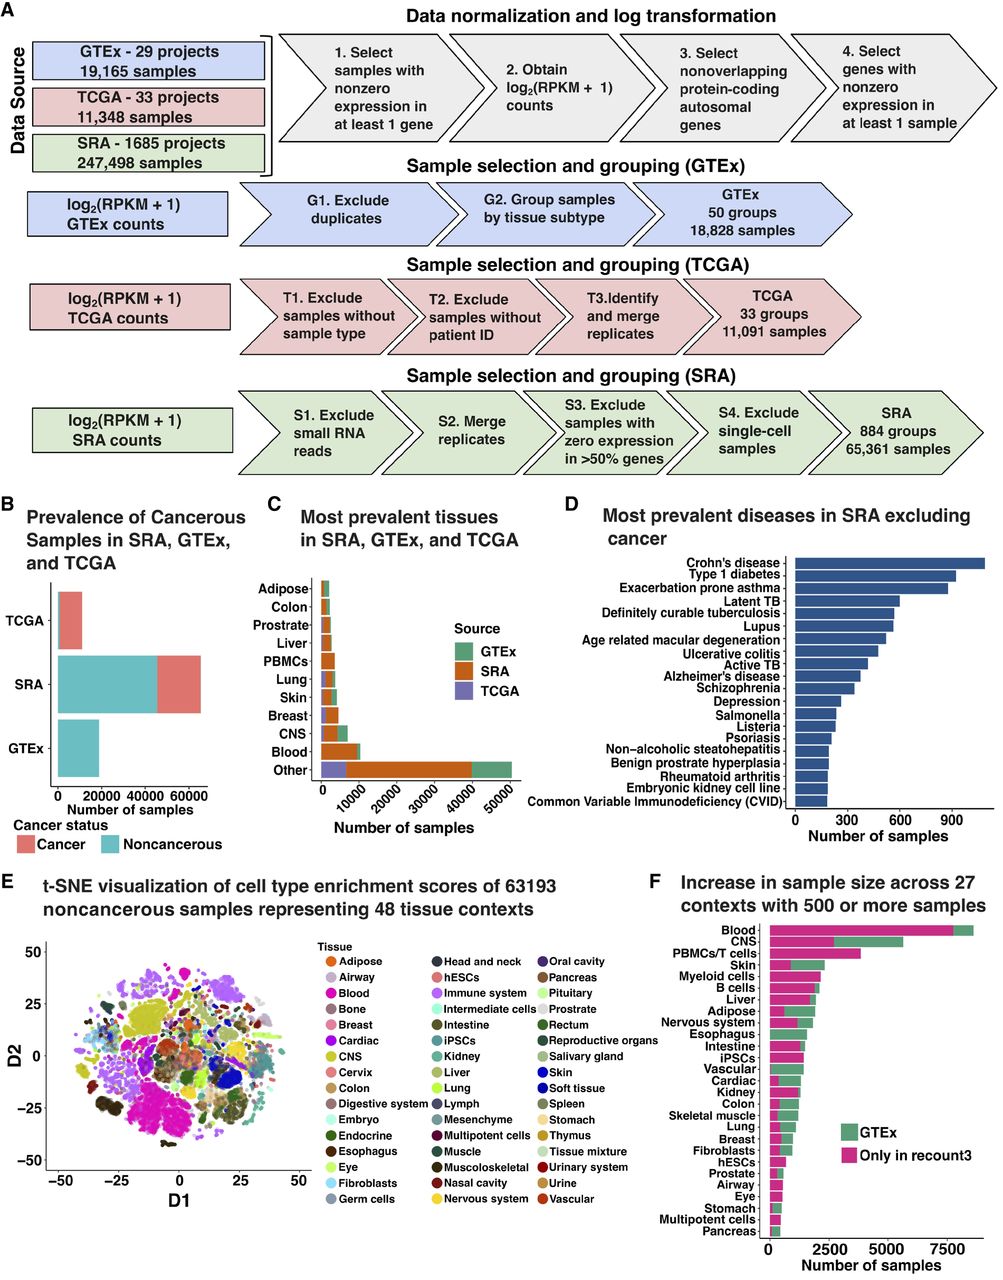
Overview of data preprocessing and annotations. (A) Gene expression data was RPKM normalized and log-transformed along with gene-specific and sample-specific filters. Based on the data source, normalized gene expression was processed to merge replicates and exclude miRNA and scRNA-seq samples. (B) Number of samples which were annotated to be noncancerous and cancerous based on available metadata across GTEx, SRA, and TCGA. Sixty-three SRA samples did not have an associated annotation corresponding to cancer status. (C) Top 10 tissue labels by sample size across all three data sources: SRA, GTEx, and TCGA. (D) Top 20 diseases by sample size found in SRA that are not cancer. (E) t-SNE projection of xCell deconvolution scores of 63,193 noncancerous samples colored by the tissue of origin. (F) Increase in the sample size of 27 tissue contexts by using SRA samples compared to GTEx only. SRA studies included seven novel contexts which were not available in GTEx.


