
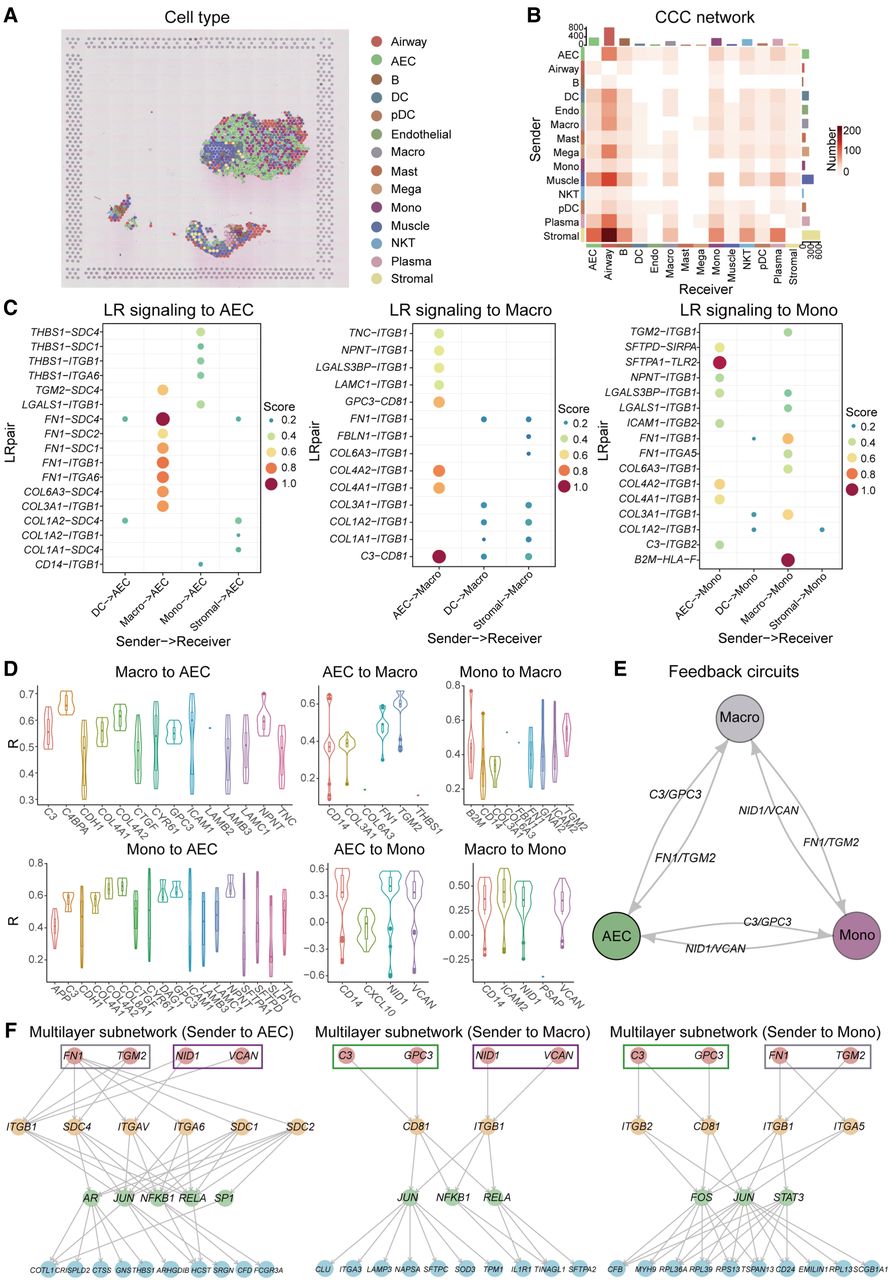
stMLnet reveals positive cellular feedback circuits and multilayer signaling regulation in ST data of COVID-19. (A) Spatial distribution of cell types in COVID-19-infected lung tissue. (B) Heatmap plot of inferred CCC network. Number in the plot represents the number of LR pairs between any two cell groups. The top color bar plot represents the sum of column of values displayed in the heatmap. The right color bar plot represents the sum of row of values. (C) Bubble plots show the LR signaling from other cell types to AEC (left panel), Macro (middle panel), and Mono (right panel), respectively. Score denotes the LR signaling activity. Top 20 LR pairs were plotted for visualization purpose. (D) Correlations between ligand genes’ expressions (intracellular targets) and their upstream LR signaling activities. Most PCC values (R) were positive except for a small fraction of monocytes. (E) Positive feedback loops between AEC, Macro, and Mono. Representative ligands acting as paracrine cytokines are shown. (F) Multilayer signaling subnetworks from representative paracrine ligands to target genes in AEC (left panel), Macro (middle panel), and Mono (right panel). Top-ranked target genes according to importance scores were prioritized for visualization.


