
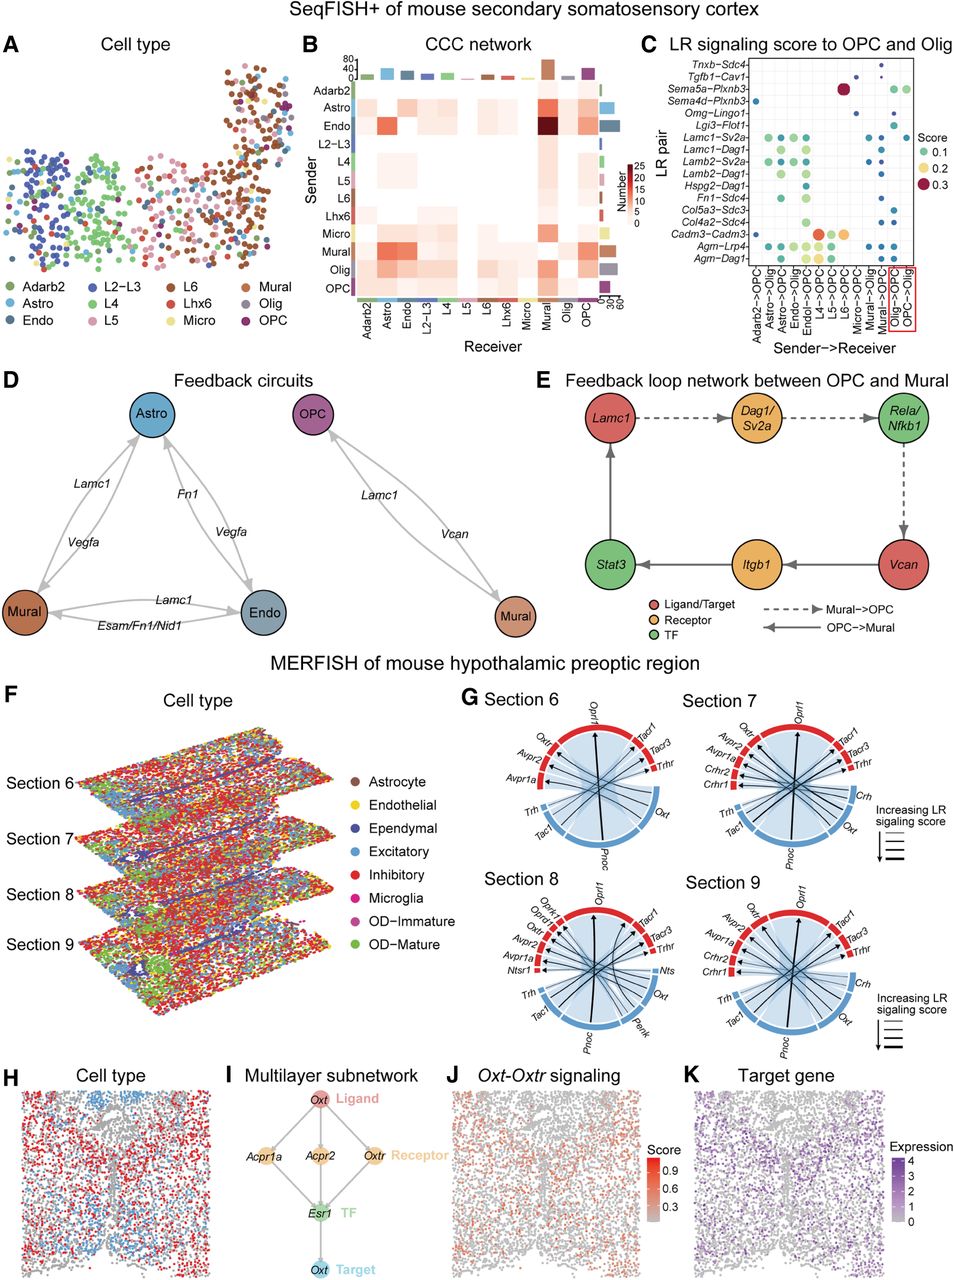
Multilayer signaling analysis of inferred CCC in seqFISH+ data and MERFISH data using stMLnet. (A–E) Multilayer signaling analysis of seqFISH+ of mouse secondary somatosensory cortex. (A) Spatial distribution of different cell types. (Adarb2) Adarb2-iNeruon, (Astro) astrocytes, (L2-L3) L2-L3-eNeuron, (Endo) endothelial, (L4) L4-eNeuron, (L5) L5-eNeuron, (L6) L6-eNeuron, (Lhx6) Lhx6-iNeuron, (Micro) microglia, (Olig) oligodendroglia, and (OPC) oligodendrocyte precursor cells. (B) Heatmap plot of inferred CCC network. “Number” in the plot represents the number of LR pairs between any two cell groups. The top color bar plot represents the sum of column of values displayed in the heatmap. The right color bar plot represents the sum of row of values. (C) Bubble plot of inferred LR signaling activity from other cell types to OPCs and Oligs. Score in the plot denotes the LR signaling activity. (D) The feedback circuits between Astro, Mural, and Endo (left) and the feedback circuits between OPC and Mural (left). Representative ligand/target genes are shown. (E) The feedback loop network between OPC and Mural. Lamc1 (ligand; red) interacts with Dag1/Sv2a (receptor; yellow), whereas Vcan (target gene; red) interacts with Itgb1 (receptor; yellow). Additionally, Lamc1 (target gene; red) is a downstream target from Vcan (ligand; red) via Stat3 (TF; green). Similarly, Vcan is a downstream target from Lamc1 through Rela/Nfkb1 (TF; green). Solid arrows represent signaling from OPC to Mural, and dashed arrows indicate signaling from Mural to OPC. (F–K) Multilayer signaling analysis of MERFISH of mouse hypothalamic preoptic region. (F) Spatial distribution of cell types in multiple tissue slices from MERFISH data. (G) Chord plot of LR signaling activity between excitatory and inhibitory. The links start from a sender cell type (excitatory; blue) and end in a receiver cell type (inhibitory; red) and each line link also connects a ligand–receptor pair. The thickness of the line represents LR signaling score: The thicker the line, the higher corresponding score. (H) Spatial distribution of excitatory and inhibitory in a section 6 slice. (I) Multilayer subnetwork of Oxt-Oxtr. The multilayer signaling subnetwork indicates the regulatory paths from a specific ligand/receptor to its downstream transcriptional factors and then to target genes. (J) The spatial distribution of specific Oxt-Oxtr signaling score. (K) The spatial distribution of target gene (Oxt).


