
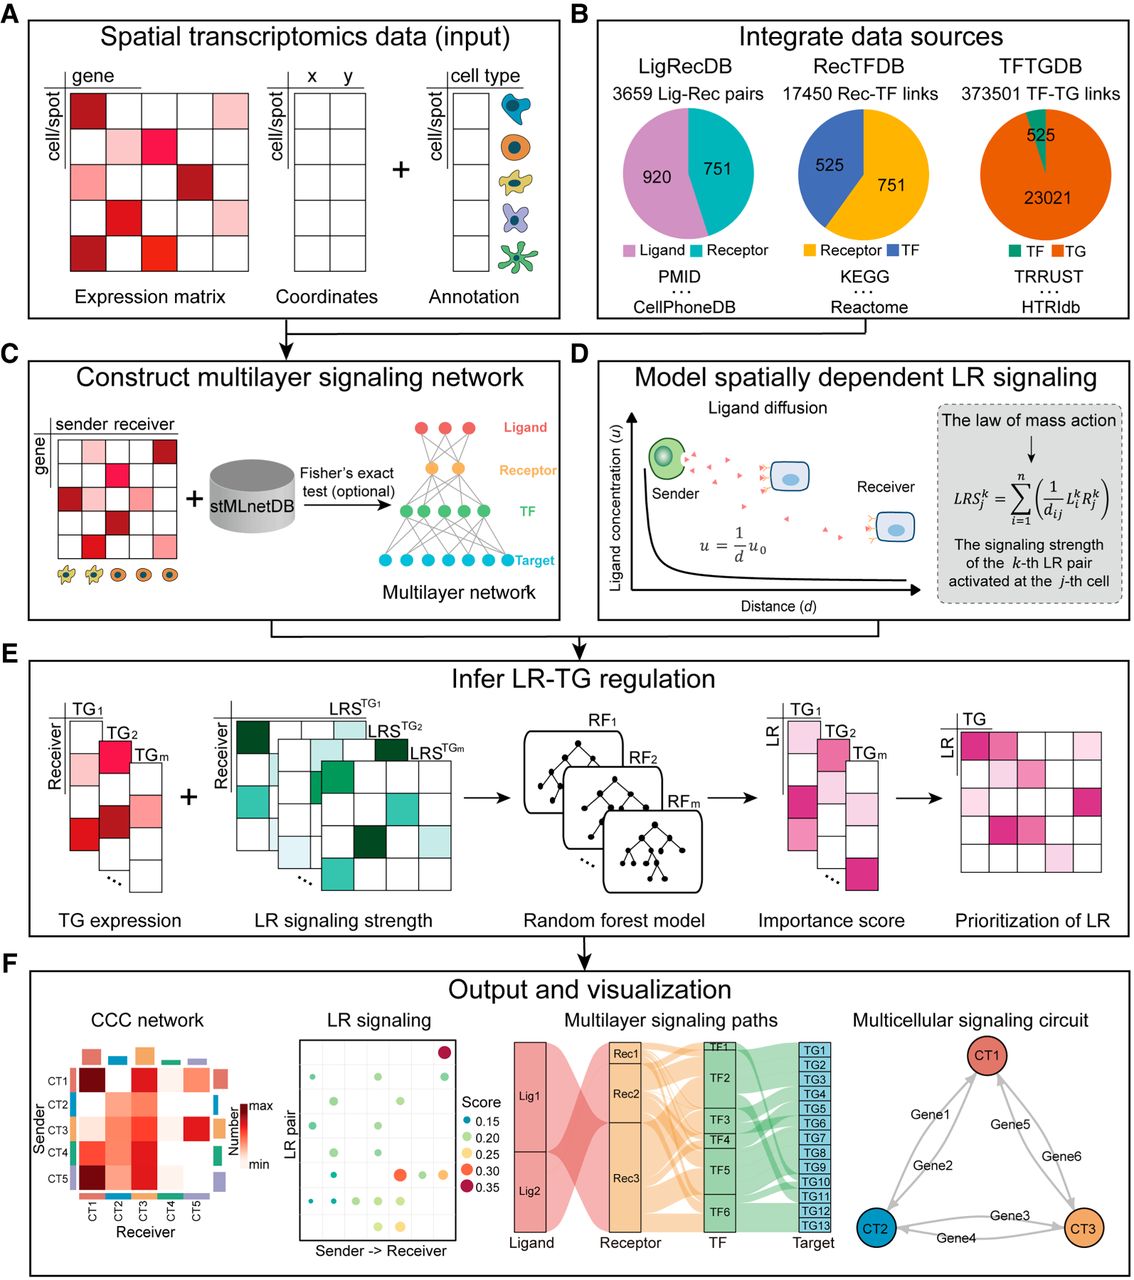
Overview of stMLnet. (A,B) Required input of stMLnet. (A) The input data consist of a gene expression matrix, spatial locations of cells/spots, and the cell type annotation vector.
(B) stMLnet integrates molecular interactions from multiple data sources (including ligand–receptor [L-R] interactions, signaling
pathways, and transcriptional regulation) to generate a prior knowledge database called stMLnetDB. Specifically, LigRecDB
contains 3659 nonredundant LR interactions, comprising 920 ligands and 751 receptors. RecTFDB includes 17,450 nonredundant
receptor–transcription factor (TF) links, consisting of 751 receptors and 525 TFs. TFTGDB consists of 373,501 transcription
factor–target gene (TF-TG) interactions, with 525 TFs and 23,021 target genes. (C–E) Workflow of stMLnet. (C) Statistical inference of multilayer signaling network. Combining the stMLnetDB and gene expression data, stMLnet uses Fisher's
exact test (optional) to construct multilayer signaling network of ligand-receptor–transcriptional factors–target genes (L-R-TF-TG).
(D) Quantification of LR signaling activity. Based on the ligand diffusion model and the law of mass action, stMLnet employs
a distance-dependent function to calculate the LR signaling activity. (E) Linking LR activity to TG expression using random forest regression algorithm. stMLnet calculates the importance score of
the specific LR signaling contributing to the TG expression, which could be used to prioritize the ligands or receptors as
upstream regulators of a given target gene. LRSTGt represents the signaling scores of LR pairs (i.e.,  ) that modulate TGt. (F) Output and visualization of inferred CCCs. stMLnet provides a variety of intuitive visualization outputs, including heatmap
plot, bubble plot, waterfall plot, and multilayer path and circuit visualization.
) that modulate TGt. (F) Output and visualization of inferred CCCs. stMLnet provides a variety of intuitive visualization outputs, including heatmap
plot, bubble plot, waterfall plot, and multilayer path and circuit visualization.


