
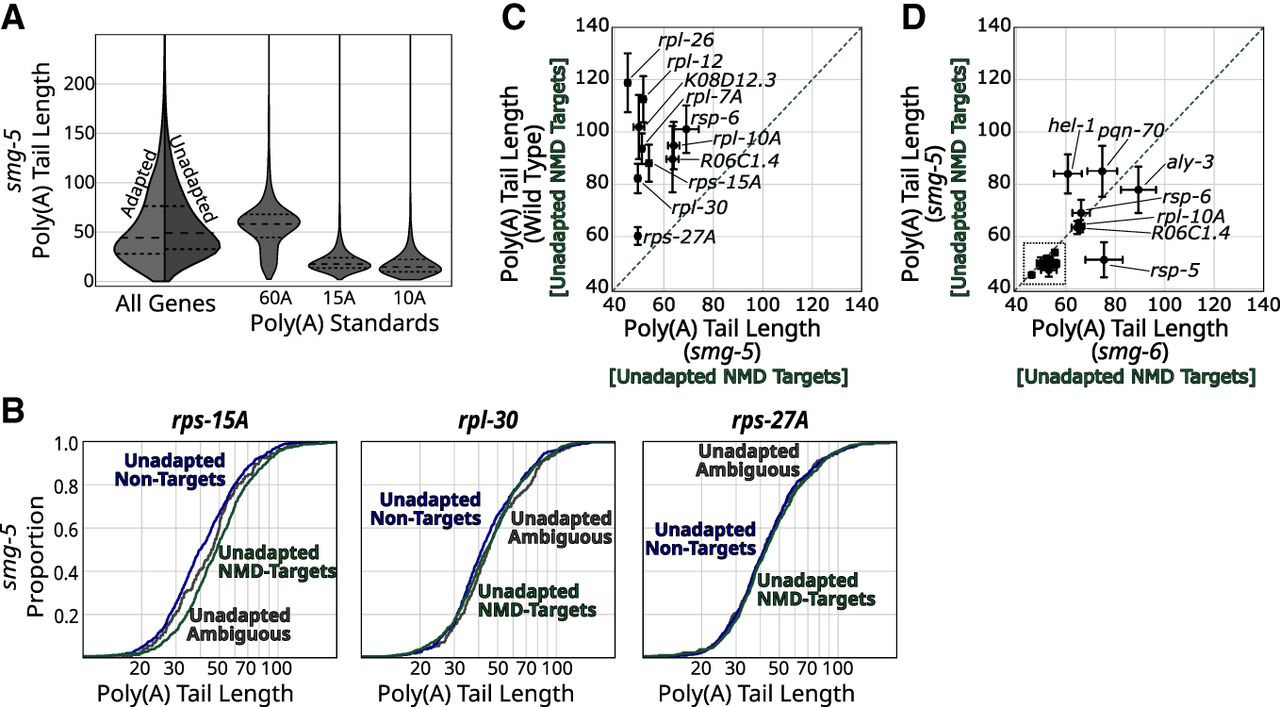
NMD-target poly(A) tail lengths resemble normal mRNAs in smg-5 animals. (A) Violin plots for all mRNAs in smg-5 animals. The left side of the violin (in light gray) shows the distribution of adapted reads’ tail lengths, and the right (in dark gray) shows unadapted reads. The three violins to the right show the tail length distributions for three spike-in RNA standards. Long dashed lines indicate the means, and short dashed lines indicate first and fourth quartile boundaries. (B) Poly(A) tail length cumulative distribution function (CDF) plots of example genes (rps-15A, rpl-30, and rps-27A) in smg-5 animals (as in Fig. 4B). The same color scheme is used here as in Figures 3 and 4: unadapted NMD isoforms (dark green), unadapted non-NMD isoforms (dark blue), and unadapted ambiguous isoforms (dark gray). For each plot, only categories that had at least 10 poly(A) tail-called reads are shown. For statistical analysis, see also Supplemental Table S4. (C) Comparison of poly(A) tail lengths between unadapted NMD targets in wild-type animals versus smg-5 animals (similar to Fig. 4E). The dashed line indicates the diagonal where X = Y. Error bars indicate the SEM. Only genes with at least 10 reads in each category are shown. (D) Comparison of poly(A) tail lengths between unadapted NMD targets in smg-6 animals versus smg-5 animals. A larger number of genes are shown compared with C because of more genes passing the cutoff of 10 reads in each category. Within the dashed box, there are nine unlabeled genes: rps-27A, rps-15A, rpl-30, rpl-12, rpl-3, C53H9.2, K08D12.3, rpl-26, and rpl-7A.


