
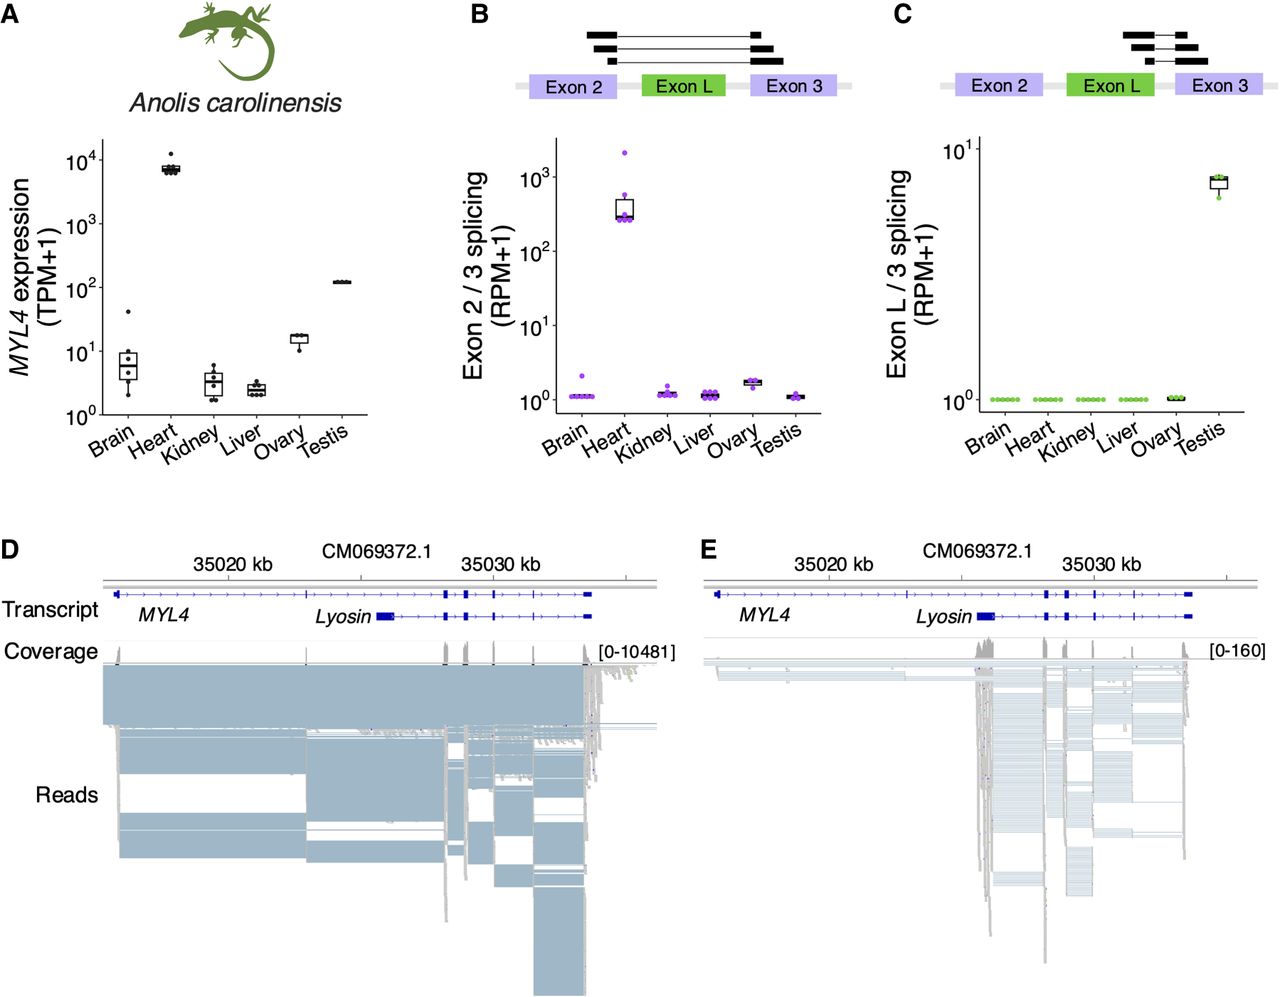
Tissue expression of the Lyosin transcript. (A) Box plot and point representations of the transcripts per million (TPM) of MYL4 expression obtained from RNA-seq data of the green anole tissues. (B,C) Box plot and point representations of splice junction reads spanning exons. The read counts were normalized as reads per million (RPM): reads spanning exons 2 and 3 (B) and reads spanning exons L and 3 (C). (D,E) Genome browser view of the MYL4 locus with RNA-seq reads of green anole. The broad blue bands represent transcripts. Transcripts of canonical MYL4 and Lyosin were constructed by genome-guided de novo assembly in this study. The gray bands below indicate mapped reads, and the blue lines between mapped reads are the gaps corresponding to the introns: heart (D) and testis (E).


