
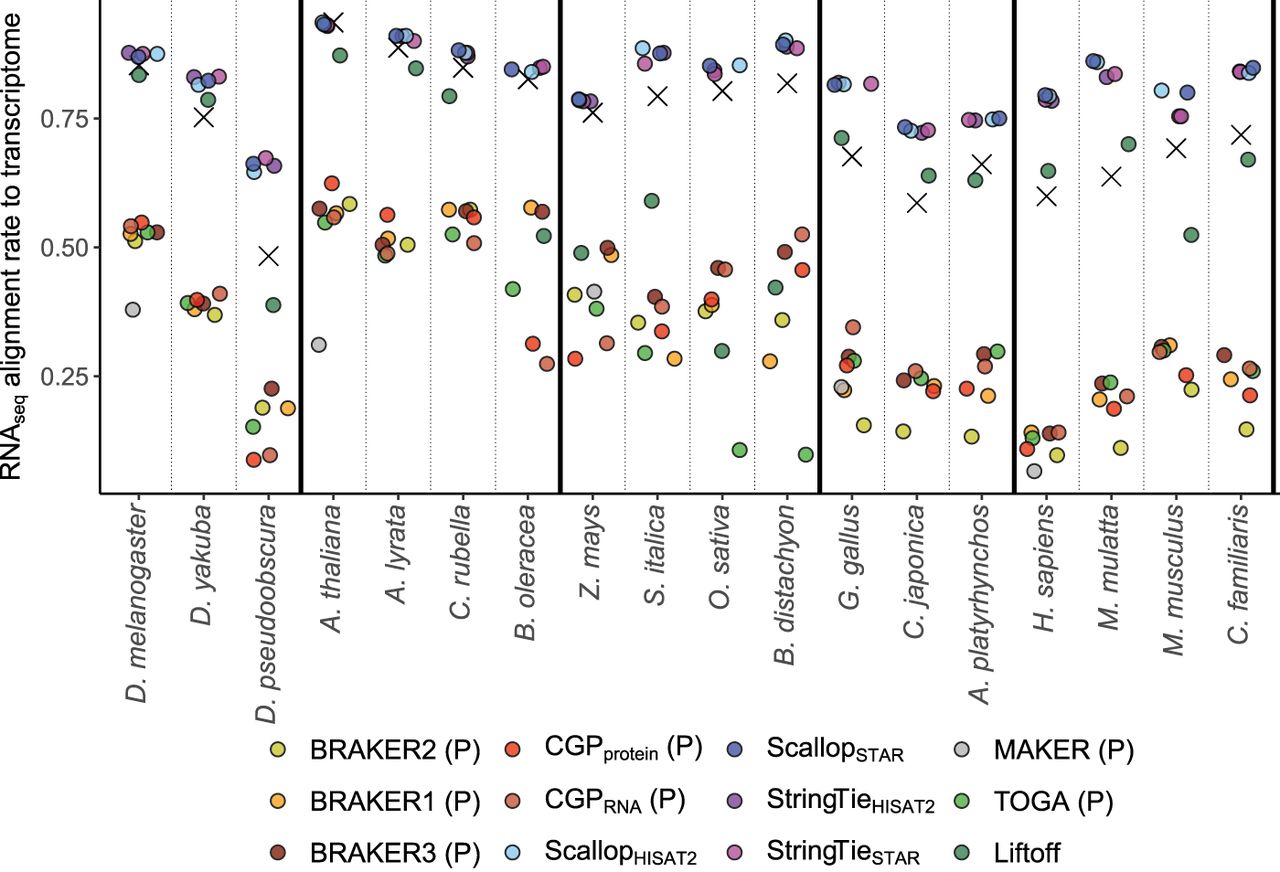
Figure 7.
RNA-seq alignment rate to transcriptomes. P's in parentheses indicate that a tool only generates CDS predictions, and X's indicate alignment rate to NCBI annotations. Species are ordered from left to right in increasing divergence from the reference species for the taxonomic group.


