
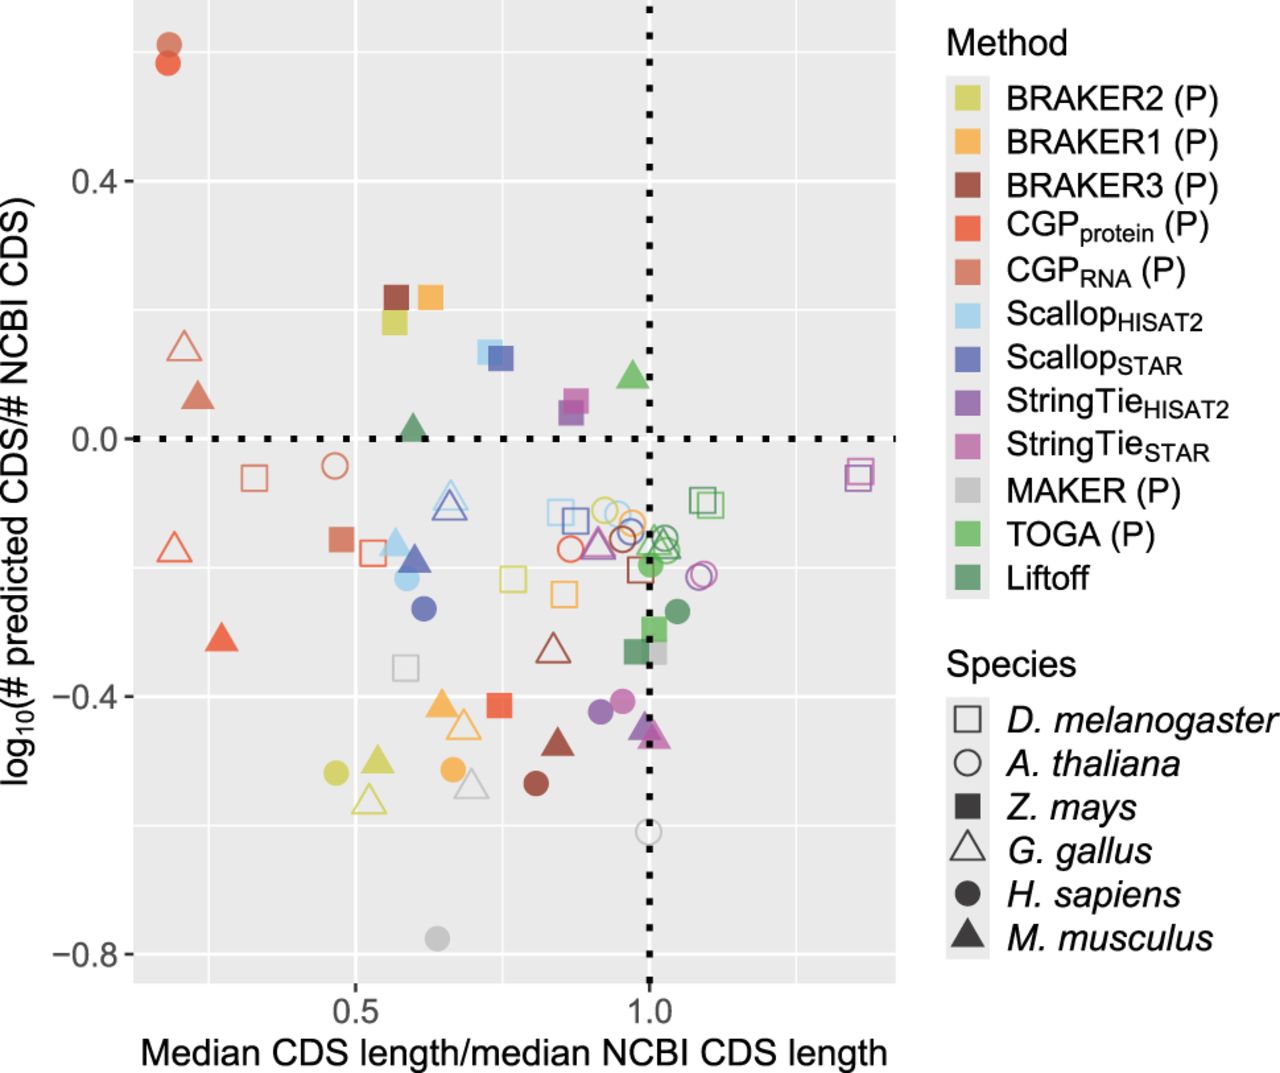
Figure 2.
Joint distributions of number of predicted CDSs (normalized by number of NCBI predictions) over median predicted CDS length (normalized by median NCBI CDS length) for the reference species for each taxonomic group we examined, as well as M. musculus. Dotted lines indicate equivalence to NCBI annotation, such that methods that are closest to the intersection of those lines best approximate CDS length and number of NCBI annotations. A “P” indicates that the method only makes protein-coding predictions.


