
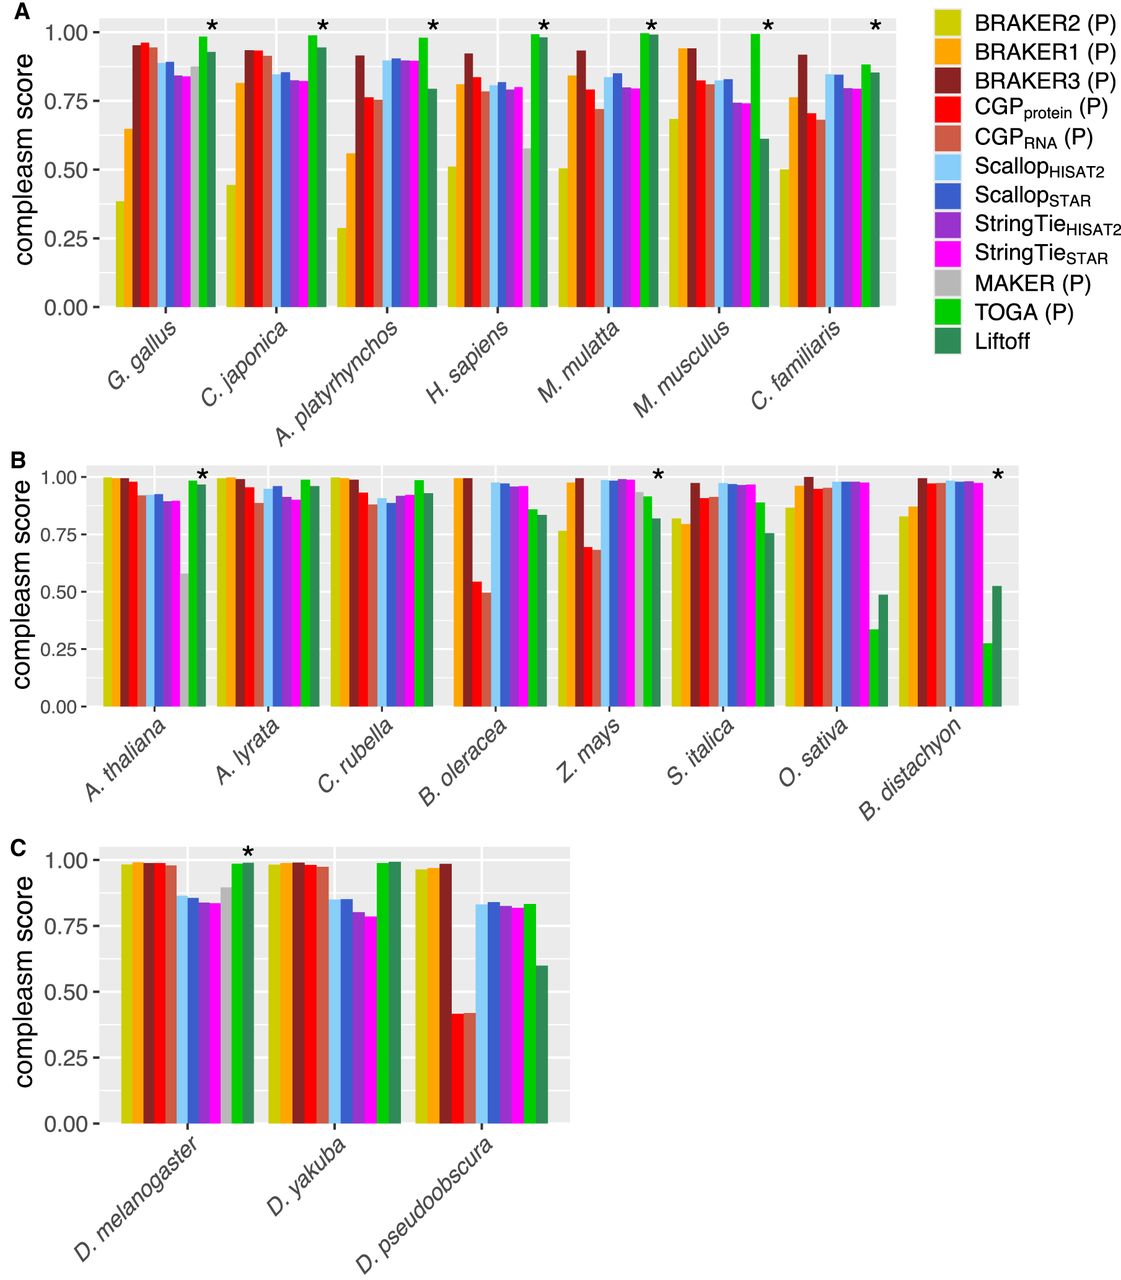
Figure 1.
Proteome compleasm scores for predicted transcripts by annotation method for vertebrates (A), plants (B), and dipteran insects (C). The score is calculated as 1 − (number missing BUSCOs/total number of BUSCOs searched). For results on lepidopterans, see Supplemental Figure S1. Asterisks indicate Liftoff annotations at which the “polishing” method was successful. Within groups, species are ordered from left to right in order of increasing evolutionary distance from the reference species. P's in parentheses indicates that the method only makes protein-coding predictions.


