
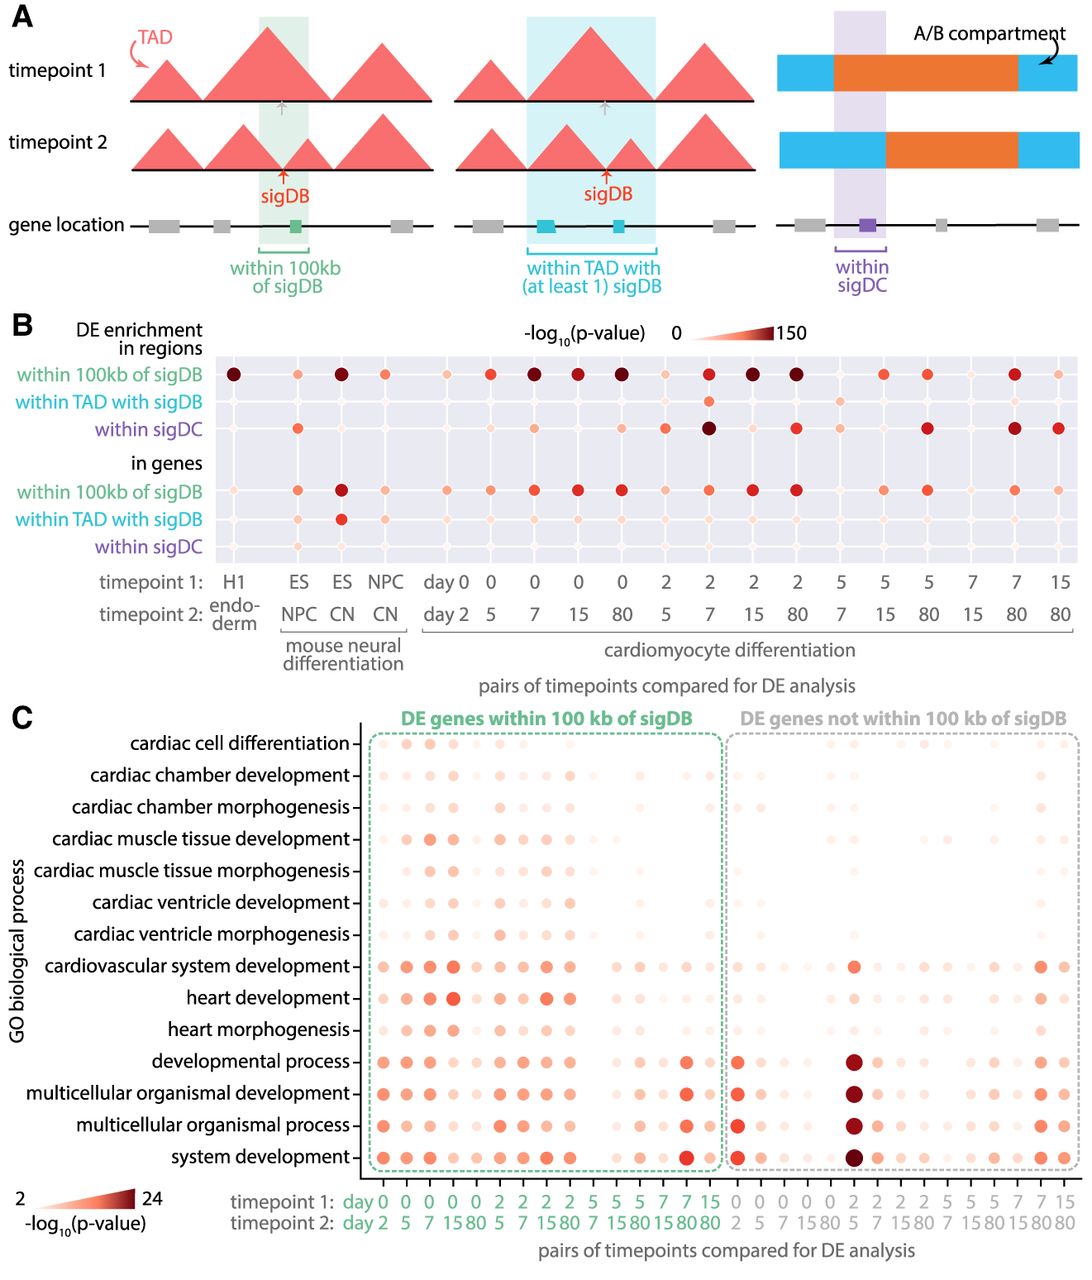
Differential gene expression near or within differential structural features. (A) Differential gene expression (DE) enrichment was measured in regions and genes near or within dynamic regions, that is, regions within 100 kb of significantly differential boundary (sigDBs), regions within TAD with at least one sigDB, and regions within sigDCs. (B) DE, sigDBs, and sigDCs were measured and identified in pairwise comparisons of time points across three mammalian differentiation data sets: H1 differentiated to endoderm, mouse neural differentiation (ESs, NPCs, CNs), and cardiomyocyte differentiation (day 0, 2, 5, 7, 15, 80). The negative log P-value of the enrichment hypergeometric test is visualized here. (C) GO biological process enrichment of genes within 100 kb of sigDB from cardiomyocyte differentiation data.


