
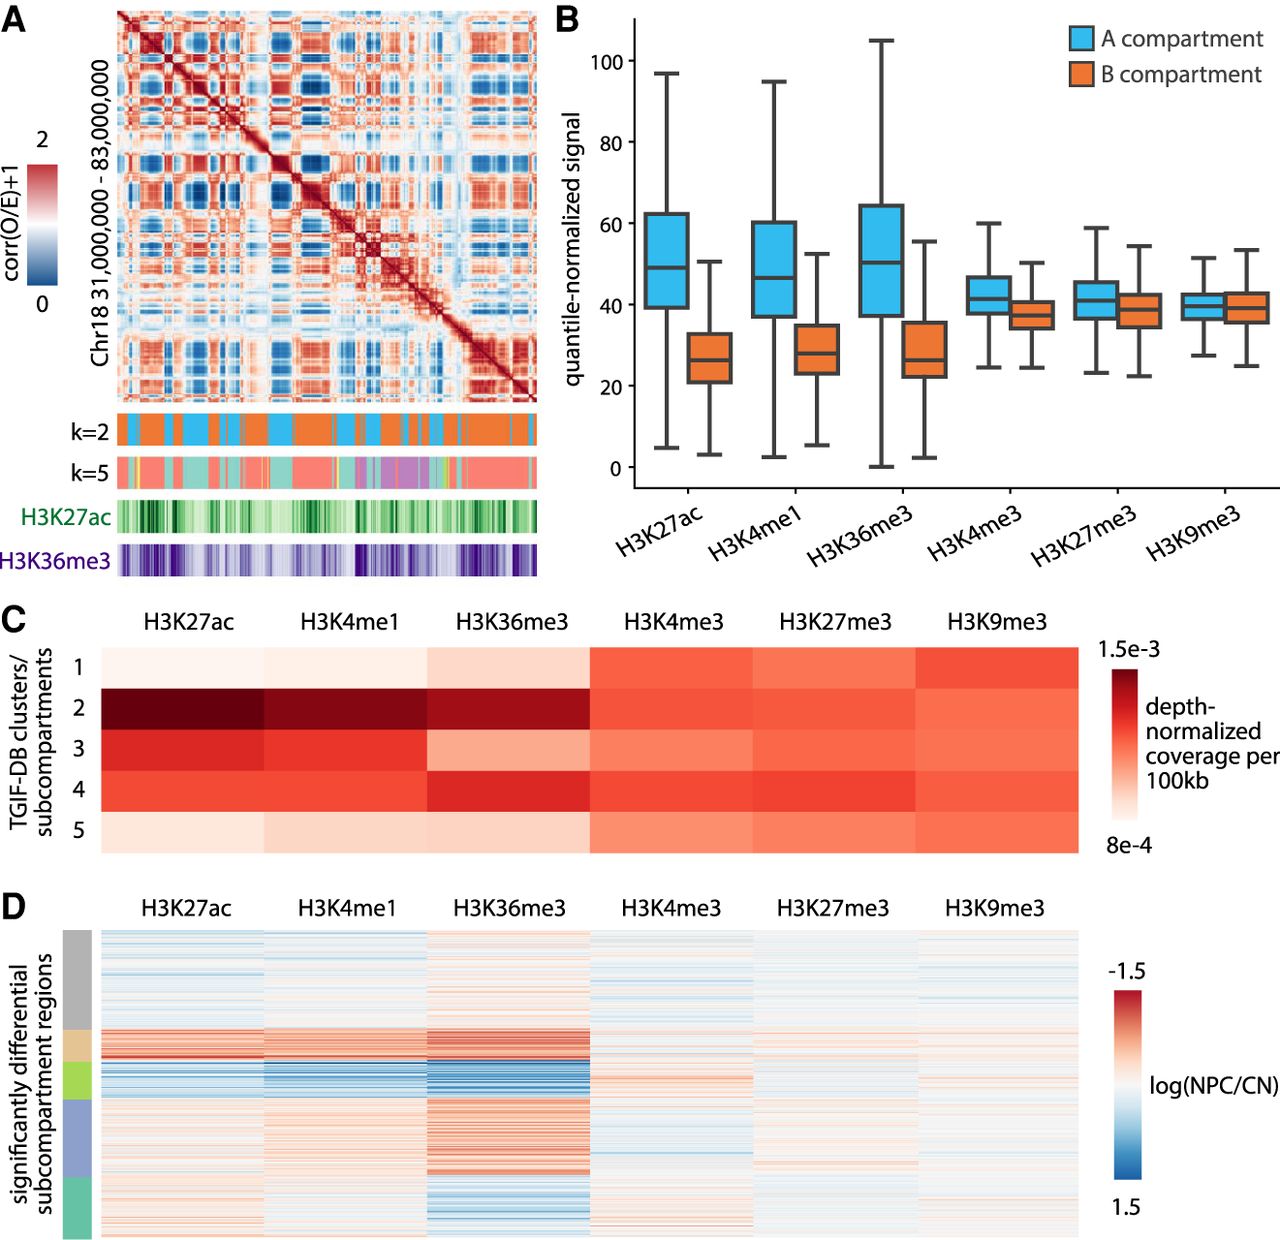
Characterizing compartments and subcompartments identified by TGIF-DC in mouse neural differentiation data. (A) A heatmap visualization of correlation matrix of O/E counts from cortical neuron (CN) Chr 18 regions at 100 kb resolution, followed by TGIF compartment assignments (i.e., clusters from k = 2) and subcompartments (e.g., clusters from k = 5), as well as H3K27ac/H3K36me3 ChIP-seq signal heatmaps. (B) Distribution of histone modification signal in A and B compartments in neural progenitors (NPCs) and CNs. (C) Mean histone modification signals across different subcompartments in NPCs and CNs. (D) Log fold change of histone modification signals between NPCs and CNs within significantly differential subcompartment regions identified by TGIF-DC. These regions were grouped based on their histone modification signal fold change patterns using k-means clustering and are visualized here.


