
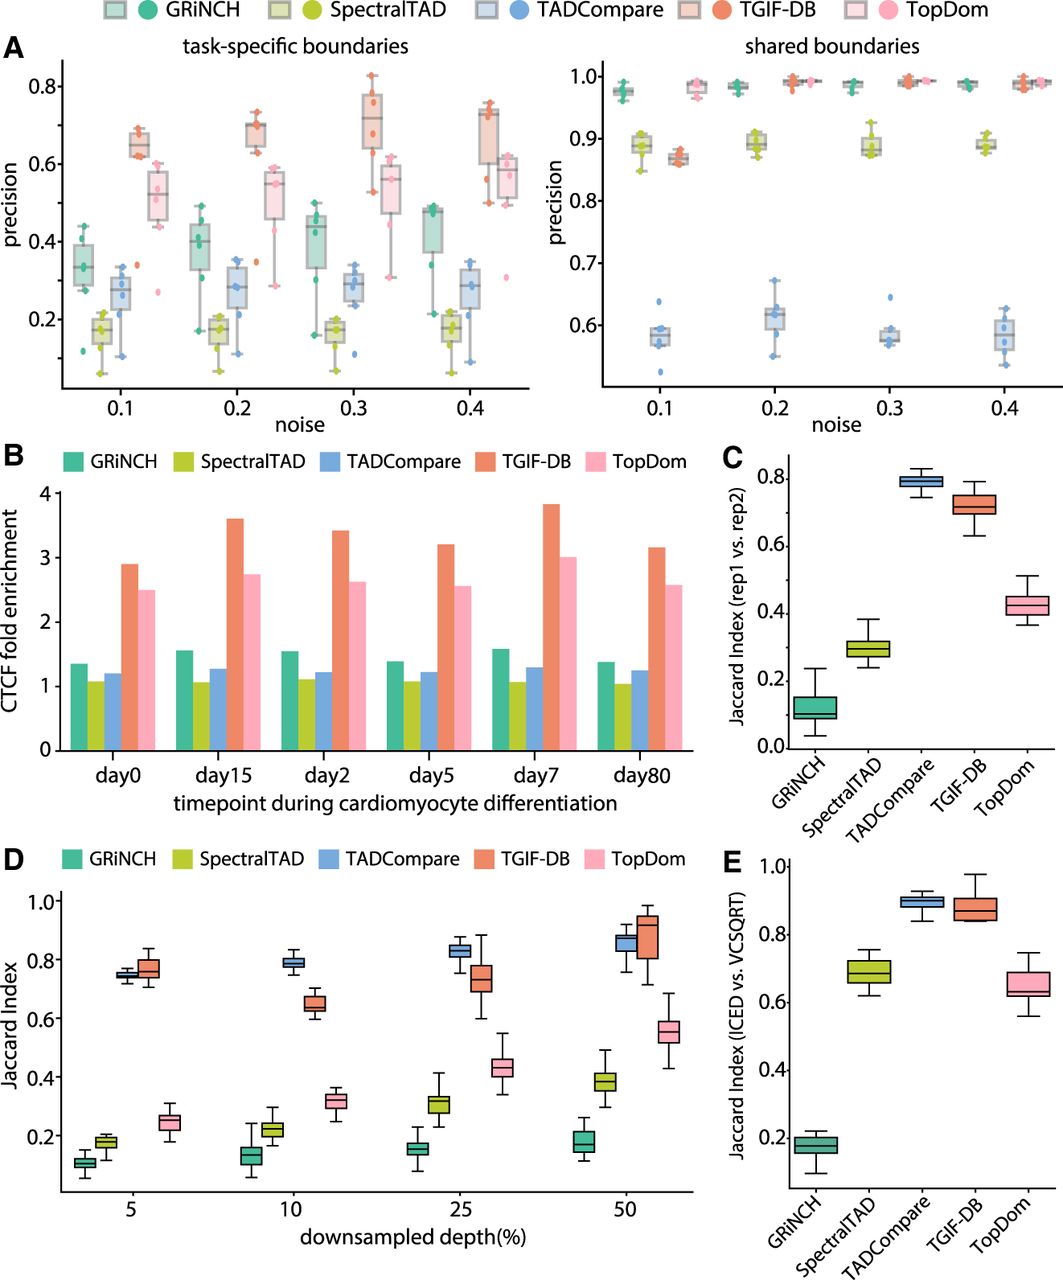
Benchmarking TGIF-DB. (A) Precision on ground-truth boundaries in simulated Hi-C matrices. Each point represents the precision from a pair of input simulated data sets compared with yield task-specific boundaries (i.e., boundaries found in one input data set but not in the other) and shared boundaries. (B) CTCF peak enrichment in boundaries from different TAD-calling and differential-boundary-calling methods. (C) Boundary set similarity between biological replicates of hESCs (from day 0 of cardiomyocyte differentiation data). (D) Boundary set similarity measured by Jaccard index between GM12878 data and downsampled data, across different downsampling depths. (E) Boundary set similarity between ICE-normalized and VCSQRT-normalized input matrices of mESCs (from mouse neural differentiation data).


