
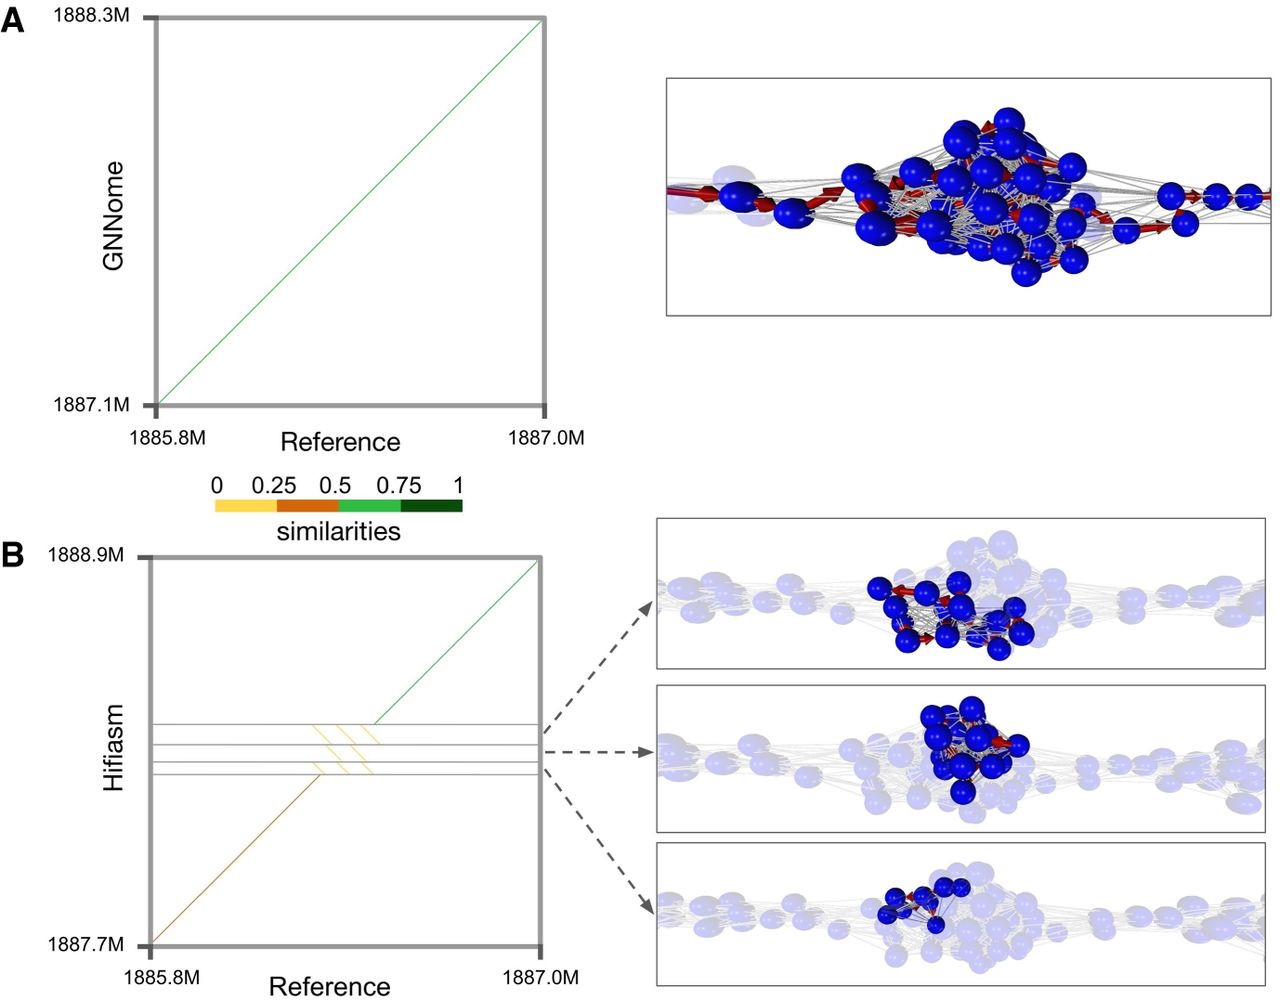
Figure 4.
Assembly comparison of Chromosome 11 centromeric region. (A) GNNome's assembly of the region. (B) Hifiasm's assembly of the region. Mappings of the assembly to the reference are visualized with dotplots, which were created with D-Genies (Cabanettes and Klopp 2018)—a tool based on minimap2 (Li 2018) alignment. The nodes that comprise each contig are visualized on the right with the help of Graphia (Freeman et al. 2022). The region covered by the tangle is ∼264.5 kb long.


