
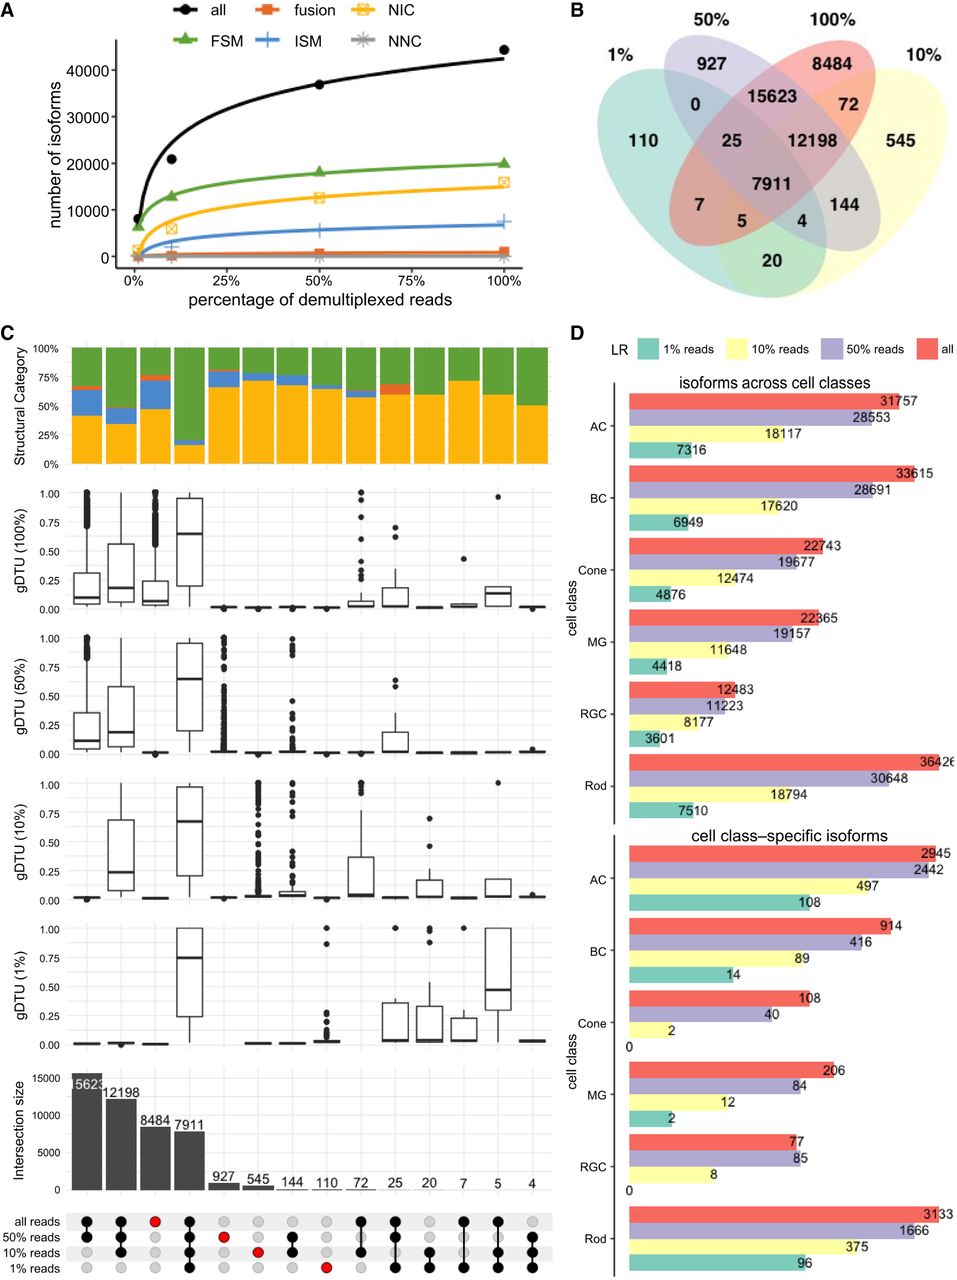
Down-sampling analysis. (A) Classification of isoforms according to their splice sites when compared to reference annotations and number of isoforms in each category detected using 100%, 50%, 10%, and 1% of demultiplexed LRs. (B) Venn diagram showing the intersection of the isoform sets detected using all, 50%, 10%, and 1% of demultiplexed LRs. (C) UpSet plot showing the intersection of isoforms detected using 100%, 50%, 10%, and 1% of demultiplexed LRs, where the number and percentage of isoforms shared by different cell classes are indicated in the bottom and top bar charts, colored by categories specified in A. The box plot shows the DTU in the gene before filtering with 2% cutoff for the isoforms in each group. (D) The bar plot shows the number of all isoforms (above) and cell class–specific isoforms (bottom) in each major retina cell class detected using 100%, 50%, 10%, and 1% of demultiplexed LRs.


