
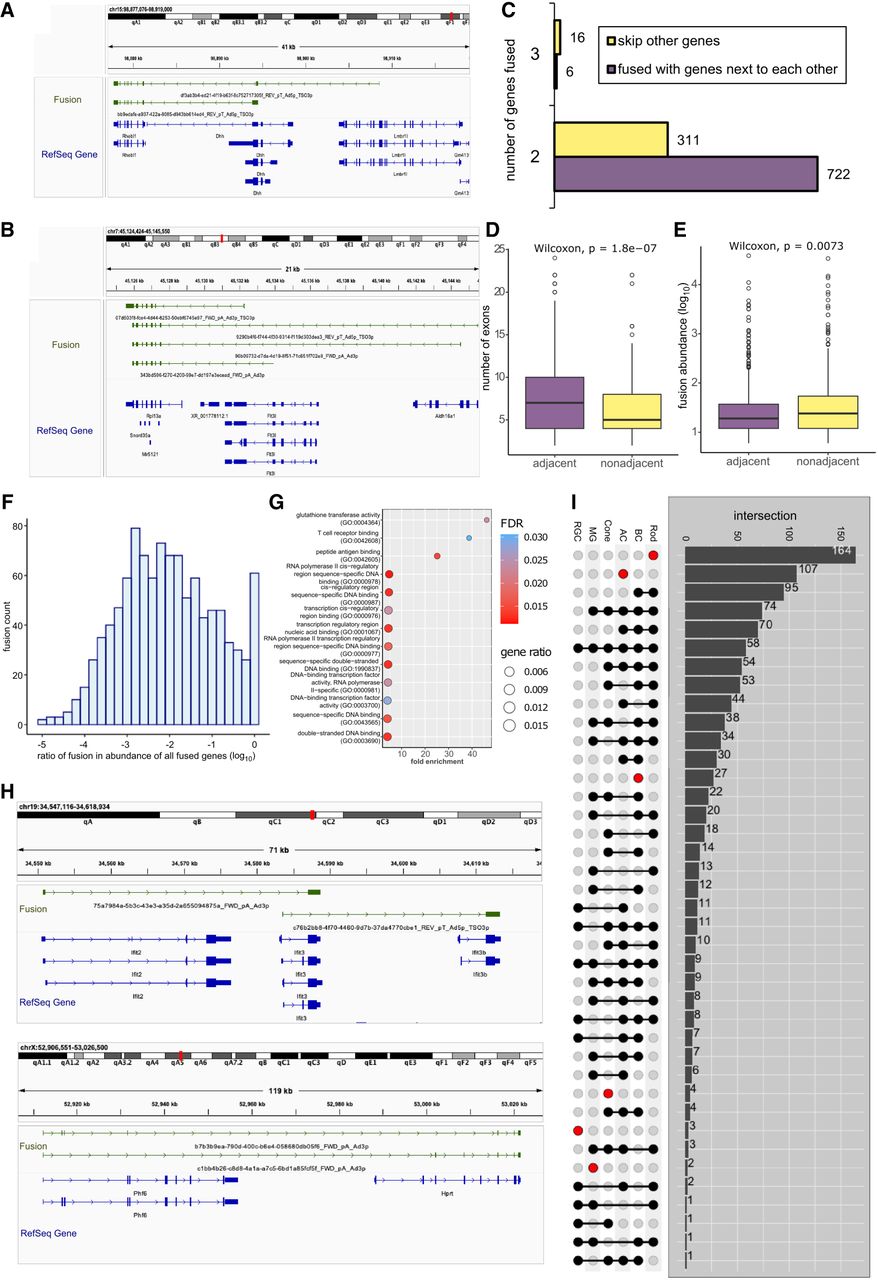
Gene fusions in mouse retina. (A) Example visual of fusions (in green) aligned to the RefSeq reference (in blue) formed by two or three known genes. (B) Example visual of fusions (in green) aligned to the RefSeq reference (in blue) formed by adjacent or distant known genes. (C) Bar chart illustrating the count of fusions, categorized by the number of fused genes and their adjacency to one another. (D) Box plot showing the exon number of fusions categorized by the adjacency of the fused genes. (E) Box plot showing isoform abundance of fusions categorized by the adjacency of the fused genes. (F) Histogram illustrating the distribution of fusion expression ratios compared to the combined expression of fused genes, with log transformation applied. (G) Bubble chart depicting the 13 molecular functions of Gene Ontology enrichment analysis ranked by fold enrichment, utilizing gene set always in fusions. (H) Example visuals of fusions (in green) aligned to the RefSeq reference (in blue). The top illustration depicted a gene (Ifit3) that can fuse with multiple other genes (Ifit2 and Ifit3b). The lower visualization highlighted the alternative splicing within the fusion (Phf6-Hprt). (I) UpSet plot showing the intersection of fusions in major retina cell classes, where number of fusions shared by different cell classes were indicated in the right bar charts.


