
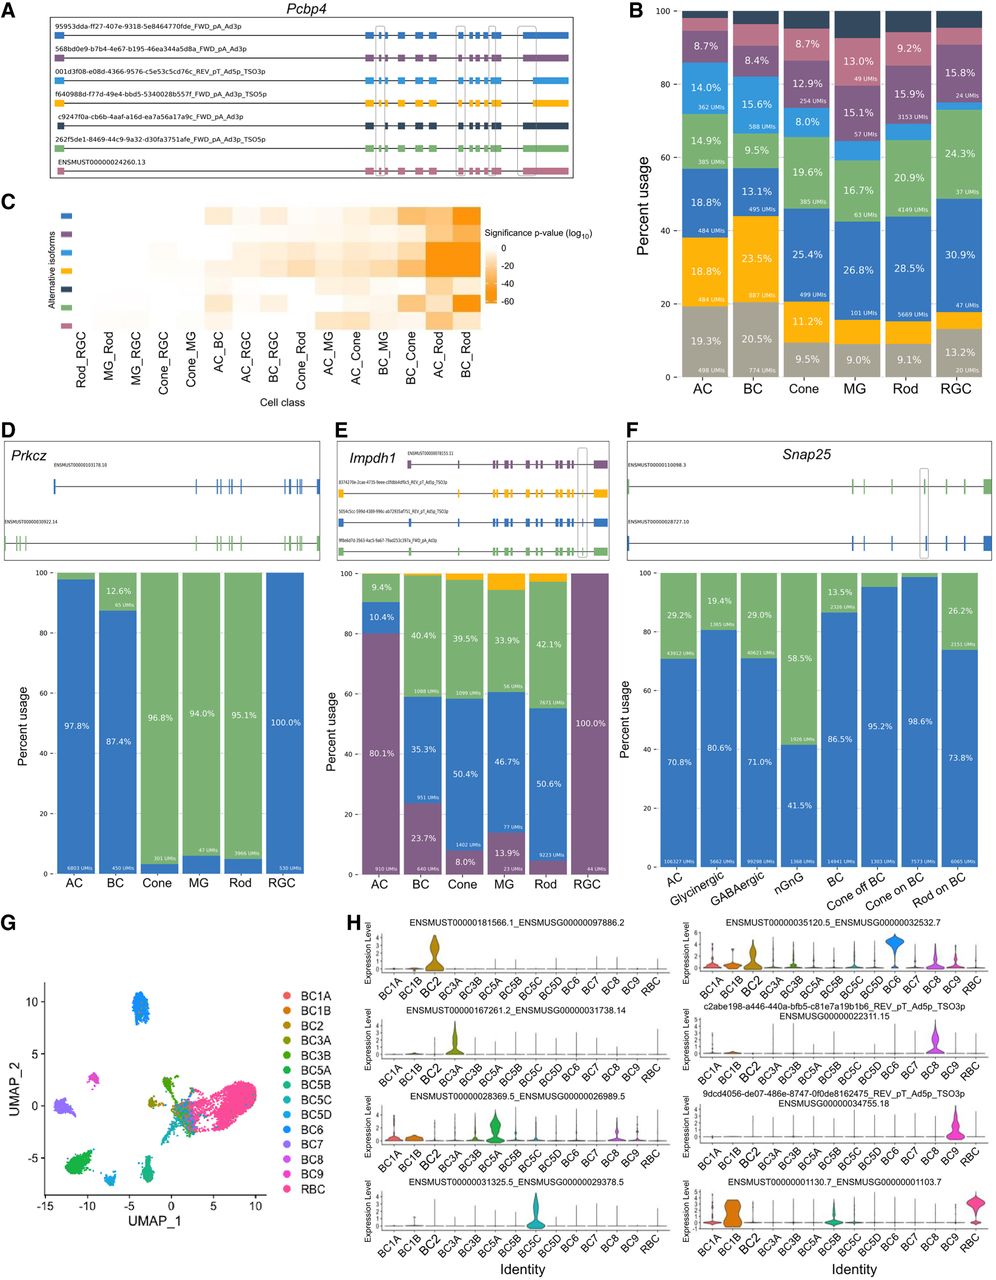
Statistics of differential usage of transcript isoforms across cell classes and subclasses. (A) Top 7 most abundant transcript isoforms of gene Pcbp4 detected. The transcription orientations for all the isoforms are from left to right. Differentially spliced sites were outlined in black. (B) Percent usage of each Pcbp4 isoform, with colors corresponding to isoforms in A. All other less abundant isoforms not plotted in A were merged and represented as gray bars. (C) Heatmap showing the significance of differential isoform usage between two major cell classes (x-axis) using Fisher's exact tests. For each isoform (y-axis, colored by isoform specified in A), the greater the disparity in isoform usage between the first and second cell classes, the lower the P-value. (D) Isoform plots and usage bar charts of Prkcz showing different isoform expression patterns across major retina cell classes. The transcription orientations for all the isoforms are from left to right. (E) Isoform plots and usage bar charts of Impdh1 showing different isoform expression patterns across major retina cell classes. The transcription orientations for all the isoforms are from left to right. The 17 bp exon was outlined in black. (F) Isoform plots and usage bar charts of Snap25 showing different isoform expression patterns across AC and BC subclasses. The transcription orientations for all the isoforms are from left to right. (G) UMAP visualization of 8863 BCs clustered using isoform as features and colored by BC subclass annotations from SR scRNA-seq. (H) Violin plot showing selected isoforms differentially expressed across BC subclasses.


